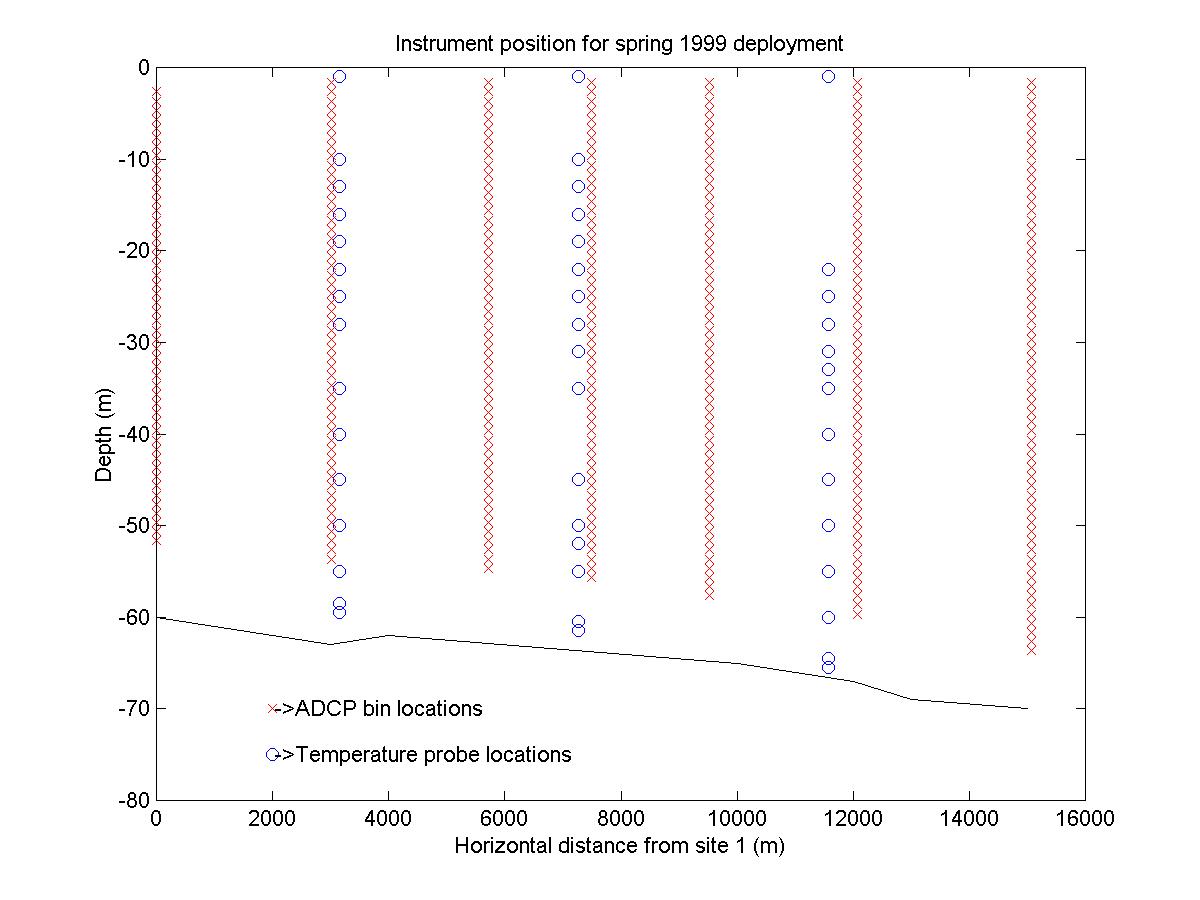
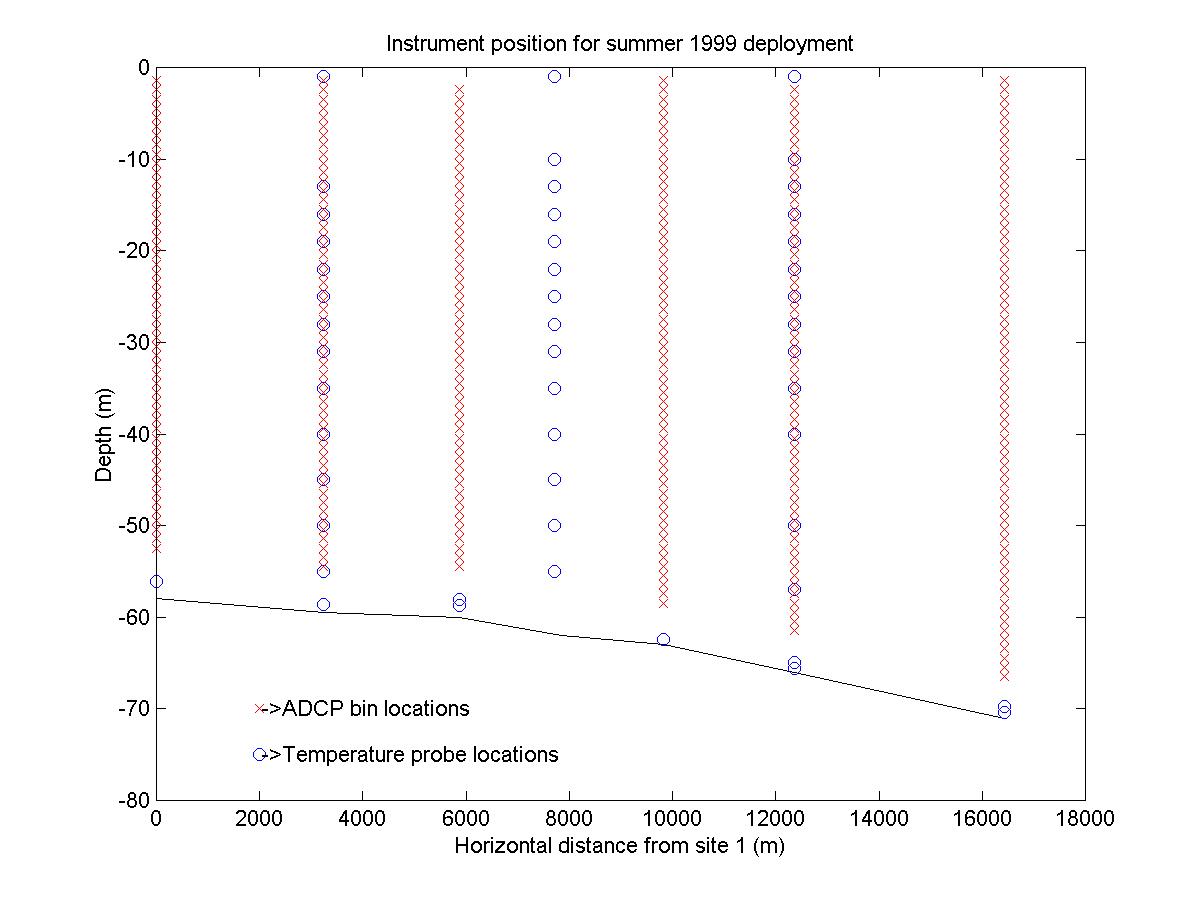
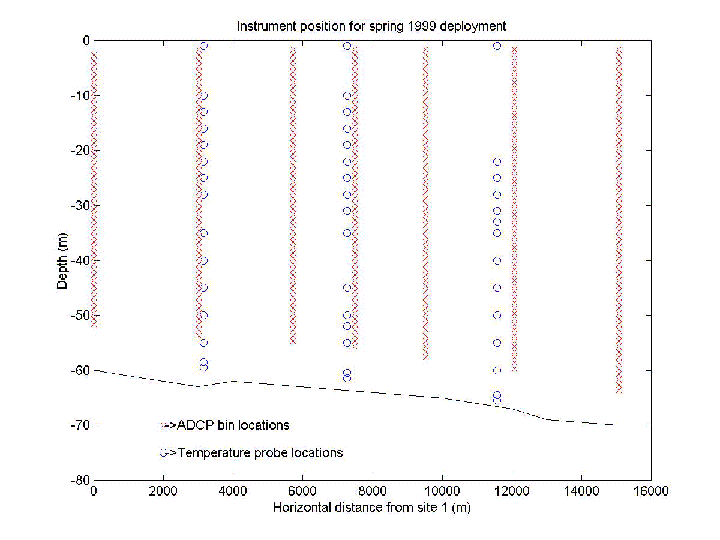
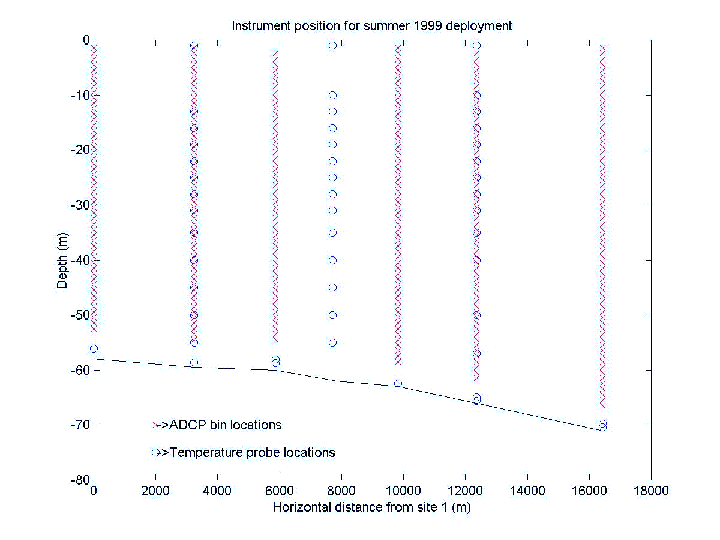
These movies depict low pass filtered velocity and temperature data from the southern flank of Georges Bank in 1999. The movies have been broken up between the spring (3/21/1999-6/10/1999) and summer (6/18/1999-8/30/1999) deployments. The instruments were moved slightly south east for the summer deployment (see Mooring Positions). The instruments were deployed colinearly roughly orthogonal to the isobaths. Velocity was measured with seven broadband (300 KHz) workhorse ADCPs which were mounted on tripods on the ocean bottom. Temperature was measured with strings of vemco temperature probes, brankers, and the internal temperature sensors on the ADCPs. The vertical and horizontal position of the instruments recovered after each deployment are depicted in spring_array.jpg and summer_array.jpg (see spring_array.gif and summer_array.gif for gif versions.) The time between frames in each movie is one hour. All contouring and quiver plots used bilinear interpolation.
spring/summer_velocity.fli: The top of each frame in this movie depicts the low passed three dimensional velocity field. The along bank (75 degrees clockwise from north) velocity is contoured with a contour interval of one cm/sec, a colorbar on the right gives the scale. Positive velocities (red) are up bank, to the east-north east. The cross bank (165 degrees clockwise from north) and vertical velocity are depicted by a two dimensional vector field with a scale given in the lower left hand corner. The topography shown in this frame is a about four meters higher than in reality to cover the edge artifacts in the countouring. At the bottom of the frame is a stick plot of the previous 48 hours of wind. The wind vectors are oriented so that up is north and to the right of the screen is to the east. the vectors move backwards in time from the right of the screen to the left.
spring/summer_velocity_temperature.fli: The top and bottom window of each movie frame are the same as those decribed in spring_1999_SFGB_velocity.fli. The middle window contains a contour of the low passed temperature data. The temperature is contoured with half a degree Celsius contour intervals, the temperature scale is given by the colorbar to the right.
A few artifacts in these films * Because of surface elevation changes the top bin of the ADCP's often give false measurements. Please interperet velocity measurements in the top 5 meters of the water column with a grain of salt.
**The branker temperature probe at one meter depth site 2 failed towards the end of the first deployment causing the odd temperature contour at the end of the movie spring_1999_SFGB_velocity_temperature.fli.
*** All movies are in FLI format which can be viewed with xanim on a unix platform or with PowerFliC on a PC. A zipped copy of PowerFLiC is available in the file pwflc252.zip.
For further information contact: Keston Smith (ksmith@whsun1.wh.whoi.edu) or Ron Schlitz (rschlitz@whsun1.wh.whoi.edu)