GTC bottle data along with US GEOTRACES North Atlantic Transect from the R/V Knorr KN199-04 cruise in the subtropical N. Atlantic during 2010 (U.S. GEOTRACES NAT project)
Project
Program
| Contributors | Affiliation | Role |
|---|---|---|
| Jenkins, William J. | Woods Hole Oceanographic Institution (WHOI) | Principal Investigator, Contact |
| Boyle, Edward A. | Massachusetts Institute of Technology (MIT) | Co-Principal Investigator |
| Cutter, Gregory A. | Old Dominion University (ODU) | Co-Principal Investigator |
| Gegg, Stephen R. | Woods Hole Oceanographic Institution (WHOI BCO-DMO) | BCO-DMO Data Manager |
Abstract
CTD bottle data from GT-C (GEOTRACES Carousel) for GT10 Transect.
Refer to the KN199-04 Cruise Report for detailed descriptions of acquisition and processing methodologies.
Refer to the KN199-04 Cruise Report for detailed descriptions of acquisition and processing methodologies.
Processing Notes:
13 Feb 2013: BCO-DMO corrected the event number of CTD cast 1 at station 6. The correct event number was verified in the original cast sheets.
The restriction to these data was removed following instructions from the Chief Scientists on April 26, 2013.
| File |
|---|
CTD_GT-C_Bottle_GT10.csv (Comma Separated Values (.csv), 411.23 KB) MD5:1167c1c57cad637fed6c8d124ad2ea4f Primary data file for dataset ID 3517 |
| Parameter | Description | Units |
| EXPOCODE | expedition code assigned by the CCHDO: NODCShipCodeYearMonthDay | text |
| SECT_ID | cruise section identification number | text |
| STNNBR | station number | integer |
| CASTNO | cast number | integer |
| GEOTRC_EVENTNO | GEOTRACES Event Number | integer |
| DATE | Date in the format YYYYMMDD | unitless |
| TIME | Time in the format HHMM | unitless |
| LATITUDE | Latitude (South is negative) | decimal degrees |
| LONGITUDE | Longitude (West is negative) | decimal degrees |
| GEOTRC_SAMPNO | GEOTRACES sample number | integer |
| SAMPNO | sequential sample number within a cast | integer |
| BTLNBR | bottle number | text |
| BTLNBR_FLAG_W | bottle quality flag | integer |
| BTL_DATE | bottle sampling date in the format YYYYMMDD | unitless |
| BTL_TIME | bottle collection time in the format HHMM | unitless |
| BTL_LAT | bottle latitude (South is negative) | decimal degrees |
| BTL_LON | bottle longitude (West is negative) | decimal degrees |
| BTMDEPTH | bottom depth | corrected meters |
| CTDPRS | CTD pressure | decibars |
| CTDDEPTH | CTD depth | meters |
| CTDTMP | CTD temperature | ITS-90 |
| CTDSAL | CTD salinity | PSS-78 |
| CTDSAL_FLAG_W | CTD salinity quality flag | integer |
| SALNTY | salinity | PSS-78 |
| SALNTY_FLAG_W | salinity quality flag | integer |
| CTDOXY | CTD oxygen | micromole/kilogram |
| CTDOXY_FLAG_W | CTD oxygen quality flag | integer |
| OXYGEN | oxygen | micromole/kilogram |
| OXYGEN_FLAG_W | oxygen quality flag | integer |
| SILCAT | sillicate | micromole/kilogram |
| SILCAT_FLAG_W | silicate quality flag | integer |
| NITRAT | nitrate | micromole/kilogram |
| NITRAT_FLAG_W | nitrate quality flag | integer |
| NITRIT | nitrite | micromole/kilogram |
| NITRIT_FLAG_W | nitrite quality flag | integer |
| PHSPHT | phosphate | micromole/kilogram |
| PHSPHT_FLAG_W | phosphate quality flag | integer |
| NITRAT_NM | nitrate, nanomolar | nanomole/kilogram |
| NITRAT_NM_FLAG_W | nitrate, nanomolar, quality flag | integer |
| NITRIT_NM | nitrite, nanomolar | nanomole/kilogram |
| NITRIT_NM_FLAG_W | nitrite, nanomolar, quality flag | integer |
| PHSPHT_NM | phosphate, nanomolar | nanomoles/liter |
| PHSPHT_NM_FLAG_W | phosphate, nanomolar quality flag | integer |
| FE_UH | Iron, reported by Univ. Hawaii | nanomoles/liter |
| FE_UH_FLAG_W | Iron, reported by Univ. Hawaii, quality flag | integer |
| AL_UH | Aluminum, reported by Univ. Hawaii | nanomoles/liter |
| AL_UH_FLAG_W | Aluminum, reported by Univ. Hawaii | integer |
| MN_UH | Manganese, reported by U. Hawaii | nanomoles/liter |
| MN_UH_FLAG_W | Manganese, reported by U. Hawaii, quality flag | integer |
| DISS_MN_USM | dissolved manganese, reported by USM | nanomole/kilogram |
| DISS_MN_USM_FLAG_W | dissolved manganese, reported by U. Southern Mississippi, quality flag | integer |
| DISS_V_USM | dissolved Vanadium, reported by U. Southern Mississippi | nanomoles/kilogram |
| DISS_V_USM_FLAG_W | dissolved Vanadium, reported by U. Southern Mississippi, quality flag | integer |
| DISS_GA_USM | dissolved Gallium, reported by U. Southern Mississippi | picomoles/kilogram |
| DISS_GA_USM_FLAG_W | dissolved Gallium quality flag, reported by USM | integer |
| REE_LA_USM | Rare Earth Element Lanthanum, reported by U. Southern Mississippi | picomoles/kilogram |
| REE_LA_USM_FLAG_W | REE Lanthanum U. Southern Mississippi quality flag | integer |
| REE_CE_USM | REE Cerium, reported by Southern Mississippi | picomoles/kilogram |
| REE_CE_USM_FLAG_W | REE Cerium, reported by Southern Mississippi, quality flag | integer |
| REE_PR_USM | REE Praseodymium, reported by U. Southern Mississippi | picomoles/kilogram |
| REE_PR_USM_FLAG_W | REE Praseodymium, reported by U. Southern Mississippi quality flag | integer |
| REE_ND_USM | REE Neodymium, USMississippi | picomoles/kilogram |
| REE_ND_USM_FLAG_W | REE Neodymium, reported by U. Southern Mississippi, quality flag | integer |
| REE_PM_USM | REE Promethium, reported by U. Southern Mississippi | picomoles/kilogram |
| REE_PM_USM_FLAG_W | REE Promethium, reported by U. Southern Mississippi, quality flag | integer |
| REE_SM_USM | REE Samarium, reported by U. Southern Mississippi | picomoles/kilogram |
| REE_SM_USM_FLAG_W | REE Samarium, reported by U. Southern Mississippi, quality flag | integer |
| REE_EU_USM | REE Europium, reported by U. Southern Mississippi | picomoles/kilogram |
| REE_EU_USM_FLAG_W | REE Europium, reported by U. Southern Mississippi, quality flag | integer |
| REE_GD_USM | REE Gadolinium, reported by U. Southern Mississippi | picomoles/kilogram |
| REE_GD_USM_FLAG_W | REE Gadolinium, reported by U. Southern Mississippi, quality flag | integer |
| REE_TB_USM | REE Terbium, reported by U. Southern Mississippi | picomoles/kilogram |
| REE_TB_USM_FLAG_W | REE Terbium, reported by U. Southern Mississippi, quality flag | integer |
| REE_DY_USM | REE Dysprosium, reported by U. Southern Mississippi | picomoles/kilogram |
| REE_DY_USM_FLAG_W | REE Dysprosium, reported by U. Southern Mississippi, quality flag | integer |
| REE_HO_USM | REE Holmium, reported by U. Southern Mississippi | picomoles/kilogram |
| REE_HO_USM_FLAG_W | REE Holmium, reported by U. Southern Mississippi, quality flag | integer |
| REE_ER_USM | REE Erbium, reported by U. Southern Mississippi | picomoles/kilogram |
| REE_ER_USM_FLAG_W | REE Erbium, reported by U. Southern Mississippi, quality flag | integer |
| REE_TM_USM | REE Thulium, reported by U. Southern Mississippi | picomoles/kilogram |
| REE_TM_USM_FLAG_W | REE Thulium, reported by U. Southern Mississippi, quality flag | integer |
| REE_YB_USM | REE Ytterbium, reported by U. Southern Mississippi | picomoles/kilogram |
| REE_YB_USM_FLAG_W | REE Ytterbium, reported by U. Southern Mississippi, quality flag | integer |
| REE_LU_USM | REE Lutetium, reported by U. Southern Mississippi | picomoles/kilogram |
| REE_LU_USM_FLAG_W | REE Lutetium, reported by U. Southern Mississippi, quality flag | integer |
| POL_ZN | labile Zinc concentration measured with polarography in the first few stations - used for contamination alert, not for ocean concentration | nanomoles/kilogram |
| POL_ZN_FLAG_W | POL Zinc, quality flag | integer |
| SOLUBLE_FE | Soluble Iron | nanomoles/kilogram |
| SOLUBLE_FE_FLAG_W | Soluble Iron, quality flag | integer |
| COLLOIDAL_FE | COLLOIDAL FE | NMOL/KG |
| COLLOIDAL_FE_FLAG_W | COLLOIDAL FE FLAG W | integer |
| NITRAT_NMOL | NITRAT NMOL | NMOL/L |
| NITRAT_NMOL_FLAG_W | NITRAT NMOL FLAG W | integer |
| NITRIT_NMOL | NITRIT NMOL | NMOL/L |
| NITRIT_NMOL_FLAG_W | NITRIT NMOL FLAG W | integer |
| PHSPHT_NMOL | PHSPHT NMOL | NMOL/L |
| PHSPHT_NMOL_FLAG_W | PHSPHT NMOL FLAG W | integer |
| ARSENATE | ARSENATE | NMOL/L |
| ARSENATE_FLAG_W | ARSENATE FLAG W | integer |
| ARSENITE | ARSENITE | NMOL/L |
| ARSENITE_FLAG_W | ARSENITE FLAG W | integer |
| MM_AS | Monomethyl Arsenic | nanomoles/liter |
| MM_AS_FLAG_W | MM AS FLAG W | integer |
| DM_AS | Dimethyl Arsenic | NMOL/L |
| DM_AS_FLAG_W | DM AS FLAG W | integer |
| AP_ACTIV | Alkaline phosphatase activity | per hour |
| AP_ACTIV_FLAG_W | AP ACTIV FLAG W | integer |
| SB_III | Antimony III | nanomoles/liter |
| SB_III_FLAG_W | Antimony III, quality flag | integer |
| SELENATE | SELENATE | NMOL/L |
| SELENATE_FLAG_W | SELENATE FLAG W | integer |
| SELENITE | SELENITE | NMOL/L |
| SELENITE_FLAG_W | SELENITE FLAG W | integer |
| ORG_SELENIDE | ORG SELENIDE | NMOL/L |
| ORG_SELENIDE_FLAG_W | ORG SELENIDE FLAG W | integer |
| TOT_DISS_SE | total dissolved Selenium | nanomoles/liter |
| TOT_DISS_SE_FLAG_W | TOT DISS SE FLAG W | integer |
| DISS_FE_II | dissolved Iron(II) | NMOL/L |
| DISS_FE_II_FLAG_W | DISS FE II FLAG W | integer |
| DISS_FE | dissolved Iron | nanomoles/liter |
| DISS_FE_FLAG_W | DISS FE FLAG W | integer |
| SILVER | SILVER | PMOL/L |
| SILVER_FLAG_W | SILVER FLAG W | integer |
| L1_FE_SHIP | average concentration of stronger dissolved iron-binding ligand, L1, determined from both linearizations of each titration combined over replicate titrations, measured on the ship | nanomoles/liter |
| L1_FE_SHIP_FLAG_W | L1 Iron measured on ship, quality flag | integer |
| LOG_K1_FE_SHIP | log of conditional stability constant of Iron, measured on the ship | (tbd) liters/mole? |
| LOG_K1_FE_SHIP_FLAG_W | log of conditional stability constant of Iron, measured on the ship, quality flag | integer |
| L2_FE_SHIP | concentration of weaker dissolved iron-binding ligand determined from both linearizations of each titration combined over replicate titrations, measured on board the ship | nanomoles/liter |
| L2_FE_SHIP_FLAG_W | L2 Iron quality flag | (tbd) |
| LOG_K2_FE_SHIP | log of conditional stability constant (K^cond_(FeL2,Fe')^cond) of weaker dissolved iron-binding ligand determined from both linearizations of each titration combined over replicate titrations; measured on the ship | (tbd) liters/mole |
| LOG_K2_FE_SHIP_FLAG_W | LOG K2 Iron, quality flag | integer |
| L1_FE_FRZ | Iron ligand 1, from frozen samples | nanomoles/liter |
| L1_FE_FRZ_FLAG_W | L1 FE FRZ FLAG W | (tbd) |
| LOG_K1_FE_FRZ | LOG K1 FE FRZ | (tbd) |
| LOG_K1_FE_FRZ_FLAG_W | LOG K1 FE FRZ FLAG W | integer |
| L2_FE_FRZ | Iron ligand 1, from frozen samples | nanomoles/liter |
| L2_FE_FRZ_FLAG_W | L2 FE FRZ FLAG W | (tbd) |
| LOG_K2_FE_FRZ | LOG K2 FE FRZ | (tbd) |
| LOG_K2_FE_FRZ_FLAG_W | LOG K2 FE FRZ FLAG W | integer |
| L1_CU_FRZ | L1 CU FRZ | NMOL/L |
| L1_CU_FRZ_FLAG_W | L1 CU FRZ FLAG W | (tbd) |
| LOG_K1_CU_FRZ | LOG K1 CU FRZ | (tbd) |
| LOG_K1_CU_FRZ_FLAG_W | LOG K1 CU FRZ FLAG W | integer |
| L2_CU_FRZ | L2 CU FRZ | NMOL/L |
| L2_CU_FRZ_FLAG_W | L2 CU FRZ FLAG W | (tbd) |
| LOG_K2_CU_FRZ | LOG K2 CU FRZ | (tbd) |
| LOG_K2_CU_FRZ_FLAG_W | LOG K2 CU FRZ FLAG W | integer |
| AL_BRUL | Aluminum concentration, as reported by Bruland | nanomoles/kilogram |
| AL_BRUL_FLAG_W | AL BRUL FLAG W | integer |
| CD_BRUL | CD BRUL | PMOL/KG |
| CD_BRUL_FLAG_W | CD BRUL FLAG W | integer |
| CO_BRUL | CO BRUL | PMOL/KG |
| CO_BRUL_FLAG_W | CO BRUL FLAG W | integer |
| CU_BRUL | CU BRUL | NMOL/KG |
| CU_BRUL_FLAG_W | CU BRUL FLAG W | integer |
| GA_BRUL | GA BRUL | PMOL/KG |
| GA_BRUL_FLAG_W | GA BRUL FLAG W | integer |
| FE_BRUL | FE BRUL | NMOL/KG |
| FE_BRUL_FLAG_W | FE BRUL FLAG W | integer |
| PB_BRUL | PB BRUL | PMOL/KG |
| PB_BRUL_FLAG_W | PB BRUL FLAG W | integer |
| MN_BRUL | MN BRUL | NMOL/KG |
| MN_BRUL_FLAG_W | MN BRUL FLAG W | integer |
| NI_BRUL | NI BRUL | NMOL/KG |
| NI_BRUL_FLAG_W | NI BRUL FLAG W | integer |
| SC_BRUL | SC BRUL | PMOL/KG |
| SC_BRUL_FLAG_W | SC BRUL FLAG W | integer |
| AG_BRUL | AG BRUL | PMOL/KG |
| AG_BRUL_FLAG_W | AG BRUL FLAG W | integer |
| TI_BRUL | TI BRUL | PMOL/KG |
| TI_BRUL_FLAG_W | TI BRUL FLAG W | integer |
| ZN_BRUL | ZN BRUL | NMOL/KG |
| ZN_BRUL_FLAG_W | ZN BRUL FLAG W | integer |
| PART_AL_TWI | particulate Aluminum, reported by Twining | picomoles/liter |
| PART_AL_TWI_FLAG_W | PART AL TWI FLAG W | integer |
| PART_P_TWI | particulate Phosphorus, reported by Twining | picomoles/liter |
| PART_P_TWI_FLAG_W | PART P TWI FLAG W | integer |
| PART_MN_TWI | PART MN TWI | PMOL/L |
| PART_MN_TWI_FLAG_W | PART MN TWI FLAG W | integer |
| PART_FE_TWI | PART FE TWI | PMOL/L |
| PART_FE_TWI_FLAG_W | PART FE TWI FLAG W | integer |
| PART_CO_TWI | PART CO TWI | PMOL/L |
| PART_CO_TWI_FLAG_W | PART CO TWI FLAG W | integer |
| PART_NI_TWI | PART NI TWI | PMOL/L |
| PART_NI_TWI_FLAG_W | PART NI TWI FLAG W | integer |
| PART_CU_TWI | PART CU TWI | PMOL/L |
| PART_CU_TWI_FLAG_W | PART CU TWI FLAG W | integer |
| PART_ZN_TWI | PART ZN TWI | PMOL/L |
| PART_ZN_TWI_FLAG_W | PART ZN TWI FLAG W | integer |
| PART_CD_TWI | PART CD TWI | PMOL/L |
| PART_CD_TWI_FLAG_W | PART CD TWI FLAG W | integer |
| DCM_TWI | DCM TWI | PMOL/L |
| DCM_TWI_FLAG_W | DCM TWI FLAG W | integer |
| MN_LAND | Mn concentration as reported by W. Landing | nanomoles/liter |
| MN_LAND_FLAG_W | MN LAND FLAG W | integer |
| FE_LAND | FE LAND | NMOL/L |
| FE_LAND_FLAG_W | FE LAND FLAG W | integer |
| CO_LAND | CO LAND | NMOL/L |
| CO_LAND_FLAG_W | CO LAND FLAG W | integer |
| NI_LAND | NI LAND | NMOL/L |
| NI_LAND_FLAG_W | NI LAND FLAG W | integer |
| CU_LAND | CU LAND | NMOL/L |
| CU_LAND_FLAG_W | CU LAND FLAG W | integer |
| ZN_LAND | ZN LAND | NMOL/L |
| ZN_LAND_FLAG_W | ZN LAND FLAG W | integer |
| CD_LAND | CD LAND | NMOL/L |
| CD_LAND_FLAG_W | CD LAND FLAG W | integer |
| PB_LAND | PB LAND | NMOL/L |
| PB_LAND_FLAG_W | PB LAND FLAG W | integer |
| TOT_DISS_CU | TOT DISS CU | MOL/L |
| TOT_DISS_CU_FLAG_W | TOT DISS CU FLAG W | integer |
| CU_SPEC | Cu+2 concentration | moles/liter |
| CU_SPEC_FLAG_W | CU SPEC FLAG W | integer |
| TOT_DISS_CO | TOT DISS CO | PMOL/L |
| TOT_DISS_CO_FLAG_W | TOT DISS CO FLAG W | integer |
| LABILE_CO | LABILE CO | PMOL/L |
| LABILE_CO_FLAG_W | LABILE CO FLAG W | integer |
| D56FE | dissolved Iron-56 | per milliliter |
| D56FE_FLAG_W | D56FE FLAG W | integer |
| D57FE | dissolved Iron-57 | per milliliter |
| D57FE_FLAG_W | D57FE FLAG W | integer |
| DISS_FE_WU | Soluble iron (Fe), passing through a 10 kDa cross-flow filtration membrane, reported by Wu | nanomoles/liter |
| DISS_FE_WU_FLAG_W | DISS FE WU FLAG W | integer |
| DISS_AL_WU | DISS AL WU | NMOL/L |
| DISS_AL_WU_FLAG_W | DISS AL WU FLAG W | integer |
| DISS_ZN_WU | DISS ZN WU | NMOL/L |
| DISS_ZN_WU_FLAG_W | DISS ZN WU FLAG W | integer |
| DISS_CD_WU | DISS CD WU | NMOL/L |
| DISS_CD_WU_FLAG_W | DISS CD WU FLAG W | integer |
| DISS_MN_WU | DISS MN WU | NMOL/L |
| DISS_MN_WU_FLAG_W | DISS MN WU FLAG W | integer |
| OS | Osmium concentration | femtomoles/kilogram |
| OS_FLAG_W | OS FLAG W | integer |
| OS_187_to_OS_188 | ratio of Osmium-187 to Osmium-188 | ratio |
| OS_187_to_OS_188_FLAG_W | OS-187/OS-188 FLAG W | integer |
| HG_TOTAL | HG TOTAL | PMOL/L |
| HG_TOTAL_FLAG_W | HG TOTAL FLAG W | integer |
| HG0 | concentration of gaseous elemental mercury | picomoles/liter |
| HG0_FLAG_W | HG0 FLAG W | integer |
| MM_HG | concentration of monomethylmercury | picomoles/liter |
| MM_HG_FLAG_W | monomethylmercury quality flag | integer |
| DM_HG | concentration of dimethylmercury | picomoles/liter |
| DM_HG_FLAG_W | DM HG FLAG W | integer |
| DISS_TI | dissolved Thallium | picomoles/kilogram |
| DISS_TI_FLAG_W | DISS TI FLAG W | integer |
| ZR_CONC | Zirconium concentration | picomoles/kilogram |
| ZR_CONC_FLAG_W | ZR CONC FLAG W | integer |
| HF_CONC | Hafnium concentration | picomoles/kilogram |
| HF_CONC_FLAG_W | HF CONC FLAG W | integer |
| Dataset-specific Instrument Name | GO-FLO Bottle |
| Generic Instrument Name | GO-FLO Bottle |
| Dataset-specific Description | Rapid sampling system for trace elements |
| Generic Instrument Description | GO-FLO bottle cast used to collect water samples for pigment, nutrient, plankton, etc. The GO-FLO sampling bottle is specially designed to avoid sample contamination at the surface, internal spring contamination, loss of sample on deck (internal seals), and exchange of water from different depths. |
| Dataset-specific Instrument Name | Niskin bottle |
| Generic Instrument Name | Niskin bottle |
| Generic Instrument Description | A Niskin bottle (a next generation water sampler based on the Nansen bottle) is a cylindrical, non-metallic water collection device with stoppers at both ends. The bottles can be attached individually on a hydrowire or deployed in 12, 24, or 36 bottle Rosette systems mounted on a frame and combined with a CTD. Niskin bottles are used to collect discrete water samples for a range of measurements including pigments, nutrients, plankton, etc. |
KN199-04
| Website | |
| Platform | R/V Knorr |
| Report | |
| Start Date | 2010-10-15 |
| End Date | 2010-11-04 |
| Description | This cruise constitutes the first survey section as part of the U.S. participation in an international program named GEOTRACES.
Funding: NSF OCE award 0926423
Science Objectives: To obtain state of the art trace metal and isotope measurements on a suite of samples taken on a mid-latitude zonal transect of the North Atlantic. In particular, sampling targeted the oxygen minimum zone extending off the west African coast near Mauritania, the TAG hydrothermal field, and the western boundary current system along Line W. For additional information, please refer to the GEOTRACES program Web site (https://www.geotraces.org/) for overall program objectives and a summary of properties measured.
Science Activities include seawater sampling via GoFLO and Niskin carousels, in situ pumping (and filtration), CTDO2 and transmissometer sensors, underway pumped sampling of surface waters, and collection of aerosols and rain. Hydrography, CTD and nutrient measurements were supported by the Ocean Data Facility (J. Swift) at Scripps Institution of Oceanography and funded through NSF Facilities. They provided an additional CTD rosette system along with nephelometer and LADCP. A trace metal clean Go-Flo Rosette and winch were provided by the group at Old Dominion University (G. Cutter) along with a towed underway pumping system.
Additional cruise information is available from the Rolling Deck to Repository (R2R): https://www.rvdata.us/search/cruise/KN199-04
Other Relevant Links:
List of cruise participants: [ PDF ]
Cruise track: JPEG image (from Woods Hole Oceanographic Institution, vessel operator)
ADCP data are available from the Currents ADCP group at the University of Hawaii: KN199-04 ADCP |
U.S. GEOTRACES North Atlantic Transect (GA03) (U.S. GEOTRACES NAT)
Much of this text appeared in an article published in OCB News, October 2008, by the OCB Project Office.
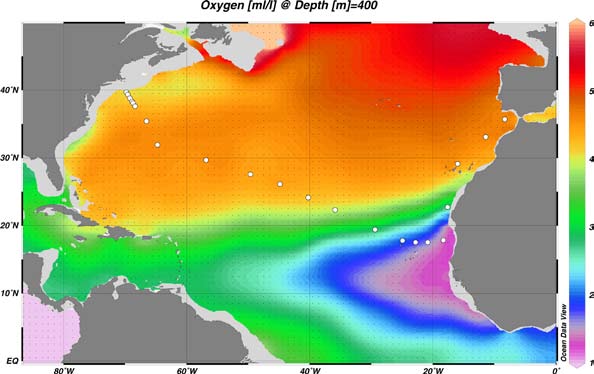
The first U.S. GEOTRACES Atlantic Section will be specifically centered around a sampling cruise to be carried out in the North Atlantic in 2010. Ed Boyle (MIT) and Bill Jenkins (WHOI) organized a three-day planning workshop that was held September 22-24, 2008 at the Woods Hole Oceanographic Institution. The main goal of the workshop, sponsored by the National Science Foundation and the U.S. GEOTRACES Scientific Steering Committee, was to design the implementation plan for the first U.S. GEOTRACES Atlantic Section. The primary cruise design motivation was to improve knowledge of the sources, sinks and internal cycling of Trace Elements and their Isotopes (TEIs) by studying their distributions along a section in the North Atlantic (Figure 1). The North Atlantic has the full suite of processes that affect TEIs, including strong meridional advection, boundary scavenging and source effects, aeolian deposition, and the salty Mediterranean Outflow. The North Atlantic is particularly important as it lies at the "origin" of the global Meridional Overturning Circulation.
It is well understood that many trace metals play important roles in biogeochemical processes and the carbon cycle, yet very little is known about their large-scale distributions and the regional scale processes that affect them. Recent advances in sampling and analytical techniques, along with advances in our understanding of their roles in enzymatic and catalytic processes in the open ocean provide a natural opportunity to make substantial advances in our understanding of these important elements. Moreover, we are motivated by the prospect of global change and the need to understand the present and future workings of the ocean's biogeochemistry. The GEOTRACES strategy is to measure a broad suite of TEIs to constrain the critical biogeochemical processes that influence their distributions. In addition to these "exotic" substances, more traditional properties, including macronutrients (at micromolar and nanomolar levels), CTD, bio-optical parameters, and carbon system characteristics will be measured. The cruise starts at Line W, a repeat hydrographic section southeast of Cape Cod, extends to Bermuda and subsequently through the North Atlantic oligotrophic subtropical gyre, then transects into the African coast in the northern limb of the coastal upwelling region. From there, the cruise goes northward into the Mediterranean outflow. The station locations shown on the map are for the "fulldepth TEI" stations, and constitute approximately half of the stations to be ultimately occupied.
Figure 1. The proposed 2010 Atlantic GEOTRACES cruise track plotted on dissolved oxygen at 400 m depth. Data from the World Ocean Atlas (Levitus et al., 2005) were plotted using Ocean Data View (courtesy Reiner Schlitzer). [click on the image to view a larger version]
Hydrography, CTD and nutrient measurements will be supported by the Ocean Data Facility (J. Swift) at Scripps Institution of Oceanography and funded through NSF Facilities. They will be providing an additional CTD rosette system along with nephelometer and LADCP. A trace metal clean Go-Flo Rosette and winch will be provided by the group at Old Dominion University (G. Cutter) along with a towed underway pumping system.
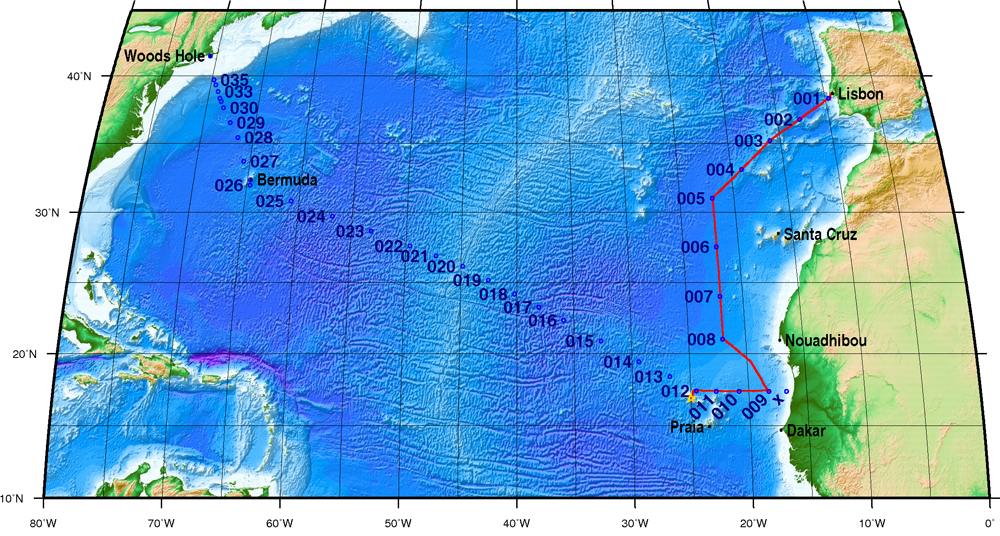
The North Atlantic Transect cruise began in 2010 with KN199 leg 4 (station sampling) and leg 5 (underway sampling only) (Figure 2).
Figure 2. The red line shows the cruise track for the first leg of the US Geotraces North Atlantic Transect on the R/V Knorr in October 2010. The rest of the stations (beginning with 13) will be completed in October-December 2011 on the R/V Knorr (courtesy of Bill Jenkins, Chief Scientist, GNAT first leg). [click on the image to view a larger version]
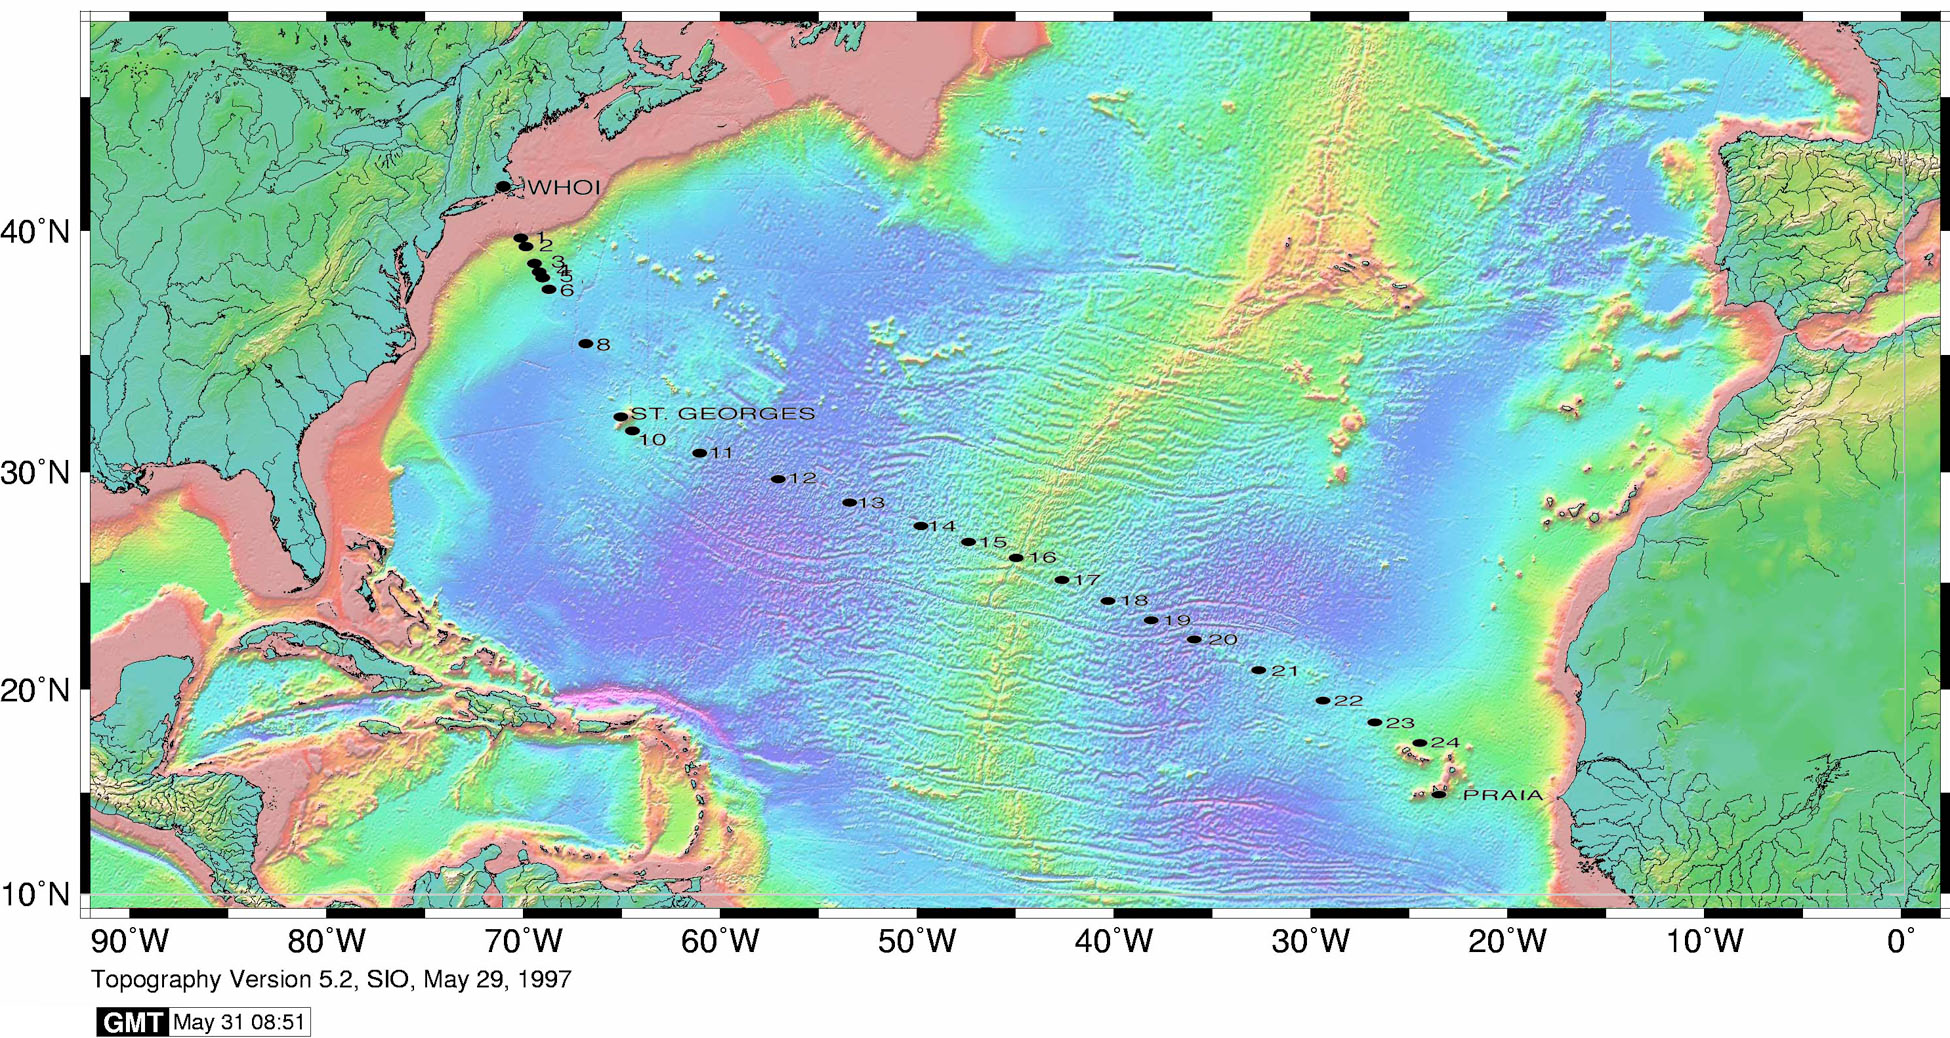
The section completion effort resumed again in November 2011 with KN204-01A,B (Figure 3).
KN204-01A,B Cruise Report (PDF)
Figure 3. Station locations occupied on the US Geotraces North Atlantic Transect on the R/V Knorr in November 2011. [click on the image to view a larger version]
Data from the North Atlantic Transect cruises are available under the Datasets heading below, and consensus values for the SAFe and North Atlantic GEOTRACES Reference Seawater Samples are available from the GEOTRACES Program Office: Standards and Reference Materials
ADCP data are available from the Currents ADCP group at the University of Hawaii at the links below:
KN199-04 (leg 1 of 2010 cruise; Lisbon to Cape Verde)
KN199-05 (leg 2 of 2010 cruise; Cape Verde to Charleston, NC)
KN204-01A (part 1 of 2011 cruise; Woods Hole, MA to Bermuda)
KN204-01B (part 2 of 2011 cruise; Bermuda to Cape Verde)
U.S. GEOTRACES (U.S. GEOTRACES)
GEOTRACES is a SCOR sponsored program; and funding for program infrastructure development is provided by the U.S. National Science Foundation.
GEOTRACES gained momentum following a special symposium, S02: Biogeochemical cycling of trace elements and isotopes in the ocean and applications to constrain contemporary marine processes (GEOSECS II), at a 2003 Goldschmidt meeting convened in Japan. The GEOSECS II acronym referred to the Geochemical Ocean Section Studies To determine full water column distributions of selected trace elements and isotopes, including their concentration, chemical speciation, and physical form, along a sufficient number of sections in each ocean basin to establish the principal relationships between these distributions and with more traditional hydrographic parameters;
* To evaluate the sources, sinks, and internal cycling of these species and thereby characterize more completely the physical, chemical and biological processes regulating their distributions, and the sensitivity of these processes to global change; and
* To understand the processes that control the concentrations of geochemical species used for proxies of the past environment, both in the water column and in the substrates that reflect the water column.
GEOTRACES will be global in scope, consisting of ocean sections complemented by regional process studies. Sections and process studies will combine fieldwork, laboratory experiments and modelling. Beyond realizing the scientific objectives identified above, a natural outcome of this work will be to build a community of marine scientists who understand the processes regulating trace element cycles sufficiently well to exploit this knowledge reliably in future interdisciplinary studies.
Expand "Projects" below for information about and data resulting from individual US GEOTRACES research projects.
| Funding Source | Award |
|---|---|
| NSF Division of Ocean Sciences (NSF OCE) | |
| NSF Division of Ocean Sciences (NSF OCE) |
[ table of contents | back to top ]