Size-fractionated major and minor particle composition and concentration from R/V Knorr KN199-04 & KN204-01 (GA03) in the subtropical North Atlantic Ocean from 2010-2011
Project
Program
| Contributors | Affiliation | Role |
|---|---|---|
| Lam, Phoebe J. | Woods Hole Oceanographic Institution (WHOI) | Principal Investigator, Contact |
| Copley, Nancy | Woods Hole Oceanographic Institution (WHOI BCO-DMO) | BCO-DMO Data Manager |
Abstract
Publications resulting from this data:
Lam, P. J., D. C. Ohnemus, and M. E. Auro. 2015. Size-fractionated major particle composition and concentrations from the US GEOTRACES North Atlantic Zonal Transect. Deep Sea Research Part II: Topical Studies in Oceanography 116: 303-320. 10.1016/j.dsr2.2014.11.020
Ohnemus, D. C., & Lam, P. J. (2015). Cycling of lithogenic marine particles in the US GEOTRACES North Atlantic transect. Deep Sea Research Part II: Topical Studies in Oceanography, 116, 283–302. doi:10.1016/j.dsr2.2014.11.019
Changes to each version:
Version 5.1: no change in data, just re-ordered columns.
Version 5: submitted to BCO-DMO 2018-07-18 - Metadata: error corrected in Parameter names, descriptions, units for "Litho_AlUCC" and "Litho_TiDust" (equation should be divided by 1000 ng/ug--data were correct) - Many parameters, especially particulate trace metals in the large size fraction (*_sink) and some very low abundance trace metals in the small size fraction (*_susp), appeared as 0 because not enough decimal places were specified. This has been corrected for all particulate trace metals (parameters from Ag to Zn, inclusive) - Quality flags for Cu, Ni, P, V, Zn changed from QF=8 to QF=1
Version 4: submitted to BCO-DMO 2014-12-11
- Longitude for GT11-10 (BATS) changed from 295.27°E to 295.9°E to be consistent with event log from
- Added missing pTM data and parameters that derive from pTM (eg. Litho, Fe(OH)3, MnO2, SPM) for GT11-20, 3500m and GT11-22, 3600m
- SPM_LithoTiDust_susp and SPM_LithoTiDust_sink, which were calculated using a Ti-based estimate of lithogenic material, have been replaced by SPM_susp and SPM_sink, which were calculated using an Al-based estimate of lithogenic material. Details are in Lam, P.J., et al., Size-fractionated major particle composition and concentrations from the US GEOTRACES North Atlantic Zonal Transect. Deep-Sea Res. II (2014), http://dx.doi.org/10.1016/j.dsr2.2014.11.020.
- Most of the PIC_susp data for the meridional stations (GT10-1,3,5,7) were found to be suspect. Quality flags for PIC_susp and CaCO3_susp for affected samples have been changed to QF=8. The following variables are calculated using PIC_susp and are thus also affected: POC_susp, POM_susp, and SPM_susp. For these parameters, we used the mean PIC:TPC ratio of oligotrophic samples with high quality PIC to estimate PIC_susp from TPC_susp. Details are in Lam, P.J., et al., Size-fractionated major particle composition and concentrations from the US GEOTRACES North Atlantic Zonal Transect. Deep-Sea Res. II (2014), http://dx.doi.org/10.1016/j.dsr2.2014.11.020
Version 3: submitted to BCO-DMO 2013-10-31
-We have changed the definitions of the Quality Flags (QF) to the following to reflect incorporation of intercalibration tests:
-QF=0: good, passed intercalibration
-QF=1: unknown - oceanographically consistent, but no intercalibration done (previous versions: anomalously high or low)
-QF=4: questionable - below detection, or anomalously high or low (previous versions: below detection)
-QF=8: bad - intercalibration issues to be resolved, or known issue with sample
-see end of this document for more information
-We have updated quality flags for elements based on the revised definitions above
-QF=1: opal, TPC, PIC, POC, POM, CaCO3, Litho_AlUCC, Litho_TiDust, Fe(OH)3_TiDust, MnO2_TiDust, SPM_lithoTiDust, Ag, Nd, Th, Y
-QF=8: Cu, Ni, P, V, Zn
-TPC_susp and TPC_sink in versions 2 and 2b were corrupted. This has been fixed.
-TPC_sink for the deep cast of GT11-8 was entered incorrectly. This has been fixed
-TPC_sink and parameters derived from it (POC_sink, POM_sink, SPM_lithoTidust_sink) for the deep casts of KN199-4 GT10-5, -10, -11, -12 have been found to be anomalously low; this is likely due to improper storage of the samples before analysis, which led to degradation of the organic matter. The quality control flags for affected samples have been downgraded to 'bad' (QF=8)
-Table of blanks and detection limits now has values for phosphorus
-This metadata document now contains a table of recoveries for three certified reference materials (CRMs) relevant for our particulate trace metal data
Version 2b: submitted to BCO-DMO 2013-06-14
-'depth_n', the nominal target (uncorrected) pump depth has been added to the dataset. The originally submitted 'depth' column remains the final, corrected, and most accurate pump depth.
Version 2: submitted to BCO-DMO 2013-04-09
-PIC data have gone through an additional round of quality control and have been adjusted and improves oceanographic consistency; see section 2.3 for details. Affects CaCO3, POC, POM, SPM.
-A mistake was found in the calculations for MnO2 and Fe(OH)3 (the weight dust ratio was used instead of the molar dust ratio) and was fixed; see section 2.8
-Like for the TEIs, we now also provide error estimates for each sample for TPC, POC, PIC, opal, Litho, MnO2, Fe(OH)3 and SPM. Details for how errors are calculated for each parameter are in the relevant sections below.
-Although our standard detection limit is defined as three times the standard deviation of our dipped blank filters, we redefined the detection limit for Ti as 1 standard deviation of the blank. This increases the number of values reported for Ti, affecting MnO2, Fe(OH)3, lithogenics, and SPM.
-'PIC_method' was added to the parameter list; see list and definitions of parameters
-We have added a table of blanks and detection limits for particulate TEIs to section 2.6 of this document
-Expected changes in next version: all TEI values below the detection limit (QF=4) are currently blank. We intend to upload the actual values in the next version.
Version 1: submitted to BCO-DMO 2013-02-01
Sampling and Analytical Methodology:
1. Sampling:
Size-fractionated particles were collected using McLane Research in-situ pumps (WTS-LV) that had been modified to accommodate two flowpaths (Lam and Morris Patent pending). Typically, two casts of 8 pumps each and two filter holders per pump were deployed to collect a 16-depth profile. The wire-out was used to target nominal depths ('depth_n') during deployment. A self-recording Seabird 19plus CTD was deployed at the end of the line for both cruises. On the second cruise, three RBR data loggers were also attached to pumps #2, #5, and #8 to help correct for actual depths ('depth') during pumping. For the first cruise (KN199-4), the recorded CTD depth was near its target depth and had a small standard deviation over the course of pumping, so we report the target depth ('depth_n') as the final depth ('depth'). For the second cruise, the target depth ('depth_n') is not the same as the final depth ('depth'), since some casts experienced significant wire angles (especially in the western boundary currents), so we corrected for the wire angle based on the recorded depths in the three data loggers and terminal CTD.
Filter holders used were 142 mm-diameter 'mini-MULVFS' style filter holders with two stages for two size fractions and multiple baffle systems designed to ensure even particle distribution and prevent particle loss (Bishop et al. 2012). One filter holder/flowpath was loaded with a 51micron Sefar polyester mesh prefilter followed by paired Whatman QMA quartz fiber filters. The other filter holder/flowpath was also loaded with a 51micron prefilter, but followed by paired 0.8micron Pall Supor800 polyethersulfone filters. These filter combinations were chosen as the best compromise after extensive testing during the intercalibration process (Bishop et al. 2012). Each cast also had a full set of 'dipped blank' filters deployed. These were the full filters sets (prefilter followed by paired QMA or paired Supor filters) sandwiched within a 1micron polyester mesh filter, loaded into perforated polypropylene containers, and attached with plastic cable ties to a pump frame, and deployed. Dipped blank filters were exposed to seawater for the length of the deployment and processed and analyzed as regular samples, and thus functioned as full seawater process blanks.
All filters and filter holders were acid leached prior to use according to methods recommended in the GEOTRACES sample and sample-handing Protocols (Geotraces 2010).
In this dataset, data reported from the 51micron prefilter are referred to with a 'sink' suffix to indicate the sinking size fraction (>51micron); data reported from the main filters (QMA - 1-51micron - or Supor - 0.8 micron-51micron) are from the top filter of the pair only, and are referred to with a 'susp' suffix to indicate the suspended size fraction.
2. Analytical Methodology:
2.1. Opal (amorphous silica)
A 1/16 subsample of the top 0.8micron Supor filter, equivalent to ~30L, or of the 51micron polyester prefilter above the QMA filter, equivalent to ~60L, was analyzed for amorphous/biogenic Si concentrations using standard spectrophotometric detection of the blue silico-molydate complex. We slightly modified DeMaster’s time-series approach developed for marine sediments to correct for the contribution of lithogenic silica to the leachate (Demaster 1981), using 20mL 0.2N NaOH at 85°C for the leach, and taking a 1.6mL subsample every hour for 3 hours. The slope of the fit was negligible for shallow samples but generally increased with depth of the sample, a reflection of the increasing importance of lithogenic silica to total silica with depth; we thus proceeded with a 1 hour incubation time for shallow cast samples (<900m), and continued the time-series approach for deep cast samples (>900m). Dipped blank filters from both shallow and deep casts were used to correct the Supor data. For >51 micron samples on polyester prefilters, blank corrections were made using the average failed pump values (pumps that never turned on, or that shut off after <5% of programmed water volume was filtered) because of anomalously high prefilter dipped blank values.
The detection limit was three times the standard deviation of dipped blank samples and was 0.26 and 0.19 micronol Si/filter for shallow and deep Supor dipped blank subsamples, respectively, and was 1.05 and 0.35 micronol Si/filter for shallow and deep polyester prefilter failed pump subsamples, respectively. Values below the detection limit are flagged (QF=4).
The mass of biogenic silica (opal) was calculated assuming a hydrated form of silica: SiO2.(0.4 H2O) (Mortlock and Froelich 1989), or 67.2 g opal/mol bSi.
We use the standard deviation of the dipped blank filters used in the blank subtraction to estimate error in the reported opal value. The appropriate filter-matched standard deviations were converted to µg opal/L using volume filtered and reported in the opal_susp_sd, opal_sink_sd columns, as appropriate.
2.2 Total Particulate Carbon (TPC)
Total particulate carbon was measured using a Flash EA1112 Carbon/Nitrogen Analyzer using a Dynamic Flash Combustion technique at the WHOI Nutrient Analytical Facility. Suspended particles (1-51micron) were measured for total particulate carbon using one or two 12mm-diameter punches from the top QMA filter, representing the equivalent of 10-20L of material. For the >51micron size fraction, particles from half or a whole 51micron polyester prefilter were rinsed at sea with 1micron-filtered seawater onto a 25mm 0.8micron Sterlitech Ag filter or 25mm pre-combusted Whatman QMA filter before being dried at 60°C. A quarter of the Ag or QMA filter containing rinsed particles was analyzed for total particulate carbon, typically representing 60-120L of material.
We use the standard deviation of the dipped blank filters used in the blank subtraction to estimate error in the TPC measurement. For TPC in the suspended (0.8-51 micron) size fraction (TPC_susp), the standard deviation of 8 dipped blank or failed pump QMA filters (6.95 micronol C/filter for QMA). For TPC in the sinking (>51 micron) size fraction, the standard deviation of 8 dipped blank filters rinsed onto Ag and onto QMA were 0.52 micronol C/filter and 0.59 micronol C/filter, respectively. The appropriate filter-matched standard deviations were converted to µg C/L using volume filtered and reported in the TPC_susp_sd, TPC_sink_sd columns, as appropriate.
2.3 Particulate Inorganic Carbon (PIC) and CaCO3
PIC was measured using one of four methods noted in data column 'PIC_method':
1. Directly by coulometry (measurement of CO2 following closed-system conversion of PIC to CO2 upon addition of 1N phosphoric acid to a QMA punch or 1/16 polyester prefilter) (Honjo et al. 1995)
As CaCO3 from the measurement of salt-corrected Ca (using Na for salt correction) (Lam and Bishop 2007) on a 1/16 subsample of Supor or polyester prefilter or 2 QMA punches (2% of filter area) and measured by:
2. ICP-MS at WHOI following a 2 hr room temperature 25% glacial acetic acid leach, which was dried down and brought back up in 5% HNO3
3. ICP-MS at WHOI following a 5% (0.6N) HCl leach for 12-16 hrs at 60°C and diluted to 1% HCl
4. ICP-AES at Boston University following a 5% HCl leach overnight at room temperature
Intercomparability between methods was tested by running select samples in replicate by different methods. PIC_methods 1,2,3 had good intercomparability. There was a 20-30% offset in samples analyzed by PIC_method=4 compared to the other methods. Data from PIC_method=4 were normalized using replicate analyses from a depth profile (GT11-8 for Supor samples; GT11-24 for prefilter samples). The resulting dataset has improved oceanographic consistency. When available, the reported error is the standard deviation of replicate analyses (after normalization); if no replicate analyses were made, the reported error is the standard deviation of the dipped blank filters used in the blank subtraction for each method and filtertype, adjusted for volume filtered. The standard deviation of the blank subtraction was 18.3 µg PIC/QMA filter for coulometry and 3.0 µg PIC/prefilter or 11.0 µg PIC/Supor filter for ICP-MS. For ICP-AES, the standard deviation of the blank subtraction was 190 µg PIC/QMA filter, 61 or 12 µg PIC/Supor filter (depending on the run), and 7.1 µg PIC/prefilter.
The mass of CaCO3 is calculated stoichiometrically from the mass of PIC (CaCO3 [µg/L] = 100.08 g CaCO3/12 g C * PIC [µg/L])
2.4 Particulate Organic Carbon (POC)
POC is calculated as the difference between TPC (see 2.2) and PIC (see 2.3). Any negative numbers were set to 0. Errors were propagated from those from TPC and PIC.
2.5 Particulate Organic Matter (POM)
POM is calculated from POC (see 2.4) using a weight ratio of 1.88 g POM/g POC (Lam et al. 2011).
2.6 Particulate trace metals (pTM)
Methods for particulate trace metal (pTM) digestion and analysis are described in (Ohnemus et al. submitted) and briefly below. Total pTM concentrations in the suspended fraction (*_susp) were analyzed from 1/16 subsamples of the top Supor (0.8micron) filter. pTM totals in the sinking size fraction (*_sink) were analyzed from 1/8 subsamples (typically ~150L) of the QMA-side 51micron pre-filter. Pre-filter particles were rinsed at sea onto 25mm Supor (0.8micron) filter discs using 0.2micron-filtered surface seawater collected using clean techniques from an underway Fish system (Bruland et al. 2005). In Teflon vials (Savillex), samples were first digested using a 3:1 mixture of sulfuric acid and hydrogen peroxide at high heat to remove the Supor filter matrix, then dried. A mixture of HCl/HNO3/HF acids (all acids 4N, heated to 135°C for 4 hrs) was used to digest the material in the remaining pellet, which was then dried, reacted with a small amount of 50% HNO3/15% H2O2 to remove any remaining organics, dried, and resuspended in 5% HNO3¬ for analysis via ICP-MS (Element 2, Thermo-Finnigan). Elemental concentrations were standardized using multi-element, external standard curves prepared from NIST atomic absorption-standards in 5% HNO3¬. Standard curves were fitted using weighted least squares fits that consider instrument analytical uncertainties. Data are reported in units of [nmoles per L of seawater filtered] and have had the median of multiple (typically 12-16) dipped blank filters (analyzed using identical methods) subtracted. The detection limit of most elements was defined as 3 times the standard deviation of 12-16 dipped blank filters. We define the detection limit for Ti to be one standard deviation of the dipped blanks filters. The median and standard deviation of the dipped blank filters and detection limits for the Supor (0.8-51 micron size fraction) and polyester prefilter (>51micron size fraction) are reported in the following table in nmol per whole filter (NB: filter area of 142mm filter is 158.4 cm2):
Table 1: Dipped (filter) blanks and detection limits for 0.8-51um samples for 142mm filters (nmol/filter) (Table 1 PDF file)
In table 1 the errors (*_susp_error, *_sink_error) are reported as the 1-sigma variation of propagated instrumental analytical and standard curve uncertainties, and the variation in subtracted dipped blank filters.
The completeness of our digestion method for trace elements was assessed by digesting and analyzing three certified reference materials: a freshwater plankton CRM from the European Commision Community Bureau of Reference (BCR-414), and two marine sediments from the National Research Council of Canada (PACS-1 and MESS-3). Certified values with their standard deviation and recoveries from our lab with standard deviations, are presented in the table appended at the end of this document.
2.7 Lithogenic material
Al is usually used as a tracer of lithogenic material since it is the third most abundant element in Earth’s crust after Si and O. Al has the added advantage that its concentration does not vary much between upper continental crust (UCC Al = 8.04% by weight) and bulk continental crust (BCC Al = 8.41wt%), so the estimate of lithogenic mass is not very sensitive to lithogenic source regions. However, our data suggests that there is considerable scavenged Al in particles near the coasts, which would lead to overestimates of lithogenic mass in coastal samples. We thus calculate lithogenic mass two ways: 1) using the UCC Al concentration of 8.04% to calculate lithogenic mass (Litho_AlUCC), and 2) using Ti, a lithogenic tracer that appears to be less affected by scavenging (Litho_TiDust). Ti has the disadvantage of varying greatly as a function of different source regions (e.g., UCC Ti=0.3wt% and BCC Ti=0.54wt%). We make the assumption that the source of the lithogenic material is from African dust, and use the concentration of Ti and Al in aerosols collected on four samples between Cape Verde and Mauritania (Shelley and Landing, personal communication) to estimate a Ti composition of 0.6 wt% to estimate lithogenic mass (Litho_TiDust). We estimate an uncertainty in the lithogenic mass derived from Ti of 7%, which is the propogated uncertainty of the analytical error (1 sigma) of Ti (6%) and the variability in the estimate of the Ti composition of the collected aerosols (4%). The Ti-based estimate (Litho_TiDust) is the one that we use in subsequent calculations (eg., suspended particulate mass, section 2.9).
2.8 Fe and Mn oxyhydroxides
Fe and Mn in oxyhydroxides were calculated by subtracting Fe and Mn associated with lithogenic material. Unlike Al, crustal Fe, Mn, and Ti vary as a function of crustal material, but the ratios of Fe and Mn to Ti are less variable. We therefore use Fe/Ti = 8.736 (mole ratio) and Mn/Ti = 0.1268 (mole ratio) derived from aerosols collected on four samples between Cape Verde and Mauritania (Shelley and Landing, personal communication) to subtract the lithogenic contributions of Fe and Mn to derive Fe(OH)3_TiDust and MnO2_TiDust. For comparison, UCC Fe/Ti and Mn/Ti mole ratios are 10.0 and 0.1745, respectively. Variability in the Fe/Ti and Mn/Ti ratios in the aerosols and analytical errors for Fe, Mn, and Ti were propagated to determine the error for Fe and Mn oxyhydroxides. The variability in the Fe/Ti and Mn/Ti ratios in the aerosols was 2% and 6%, respectively. Typical analytical errors for Fe, Mn, and Ti are 3%, 3%, and 6%, respectively. We approximate the formulae for Fe and Mn oxyhydroxides to be Fe(OH)3 (ferrihydrite approximation) and MnO2 (birnessite approximation), with formula weights 106.9 g Fe(OH)3/mol Fe and 86.9 g MnO2/mol Mn, respectively. Negative numbers were set to 0.
2.9 Suspended particulate mass
Suspended particulate mass in the sinking (>51micron) and suspended (1-51micron) size fractions was estimated as the chemical dry weight of the major particulate phases, which is the sum of POM, opal, CaCO3, lithogenic material from Ti (Litho_TiDust), and Fe and Mn oxyhydroxides, and is calculated as:
SPM = 100.08 g CaCO3/12 g C * PIC [µg/L] + opal [µg/L] + 1.88 g POM/g POC * POC [µg/L] + ...
Litho_TiDust [µg/L] + Fe(OH)3_TiDust [µg/L] + MnO2_TiDust [µg/L]
Note that the resolution of this data is dictated by the lowest resolution of the component parts.
Data Processing:
The detection limit for each measurement was 3*standard deviation of multiple dipped blank filters except as noted above.
All data have had been corrected for the median of multiple (typically 12-16) dipped blanks, unless otherwise noted in the methodology.
Lab quality control (QC) included check for oceanographic consistency, comparison of profile at BATS (GT11-10) to data from the 2008 IC Baseline Station (BATS) (Planquette and Sherrell, unpublished), and comparison of pump pTM data (this dataset) to Go-flo bottle pTM data (Twining et al., in prep). Intercomparison data that were within expected analytical precision based on a multi laboratory intercalibration {Ohnemus et al. submitted} were deemed to pass lab QC.
All data have been assigned quality flags using the ODV convention and interpretation:
0=good quality - passed lab QC
1=unknown quality - oceanographically consistent, but no intercalibration possible
4=questionable quality - below detection limit or anomalously high or low
8=bad quality - failed lab QC, or known issue with sample
Table 2 (PDF): Recoveries for certified reference materials by various labs and digests.
For each CRM, certified values (mg/kg) with absolute (1SD) and relative uncertainties (RSD, %) are shown, along with recovered values and absolute uncertainties (1SD). Bold: recovered values and uncertainties converted to percent certified for summarization purposes. Underlined: comparisons to uncertified informational values from the GeoReM CRM database. NA: Not applicable (no certified or information values for comparison). *BCR414 is CRM414: 'Trace Elements in Plankton'; n=6; PACS-1 and MESS-3 'Marine Sediment Reference Materials for Trace Metals', Canadian National Research Council; n=5. 10-35mg of each CRM was used to determine recoveries. This is less than the certified mass, but better approximates loading of marine particles. Recovered values are within 1SD of the certified value for all elements except for BCR414-Mo (140%) and V (119%), PACS-1 Pb (76%), and MESS-3 Fe (91%), Pb (74%).
Additional GEOTRACES Processing:
After the data were submitted to the International Data Management Office, BODC, the office noticed that important identifying information was missing in many datasets. With the agreement of BODC and the US GEOTRACES lead PIs, BCO-DMO added standard US GEOTRACES information, such as the US GEOTRACES event number, to each submitted dataset lacking this information. To accomplish this, BCO-DMO compiled a 'master' dataset composed of the following parameters: station_GEOTRC, cast_GEOTRC (bottle and pump data only), event_GEOTRC, sample_GEOTRC, sample_bottle_GEOTRC (bottle data only), bottle_GEOTRC (bottle data only), depth_GEOTRC_CTD (bottle data only), depth_GEOTRC_CTD_rounded (bottle data only), BTL_ISO_DateTime_UTC (bottle data only), and GeoFish_id (GeoFish data only). This added information will facilitate subsequent analysis and intercomparison of the datasets.
Bottle parameters in the master file were taken from the GT-C_Bottle_GT10, GT-C_Bottle_GT11, ODF_Bottle_GT10, and ODF_Bottle_GT11 datasets. Non-bottle parameters, including those from GeoFish tows, Aerosol sampling, and McLane Pumps, were taken from the Event_Log_GT10 and Event_Log_GT11 datasets. McLane pump cast numbers missing in event logs were taken from the Particulate Th-234 dataset submitted by Ken Buesseler.
A standardized BCO-DMO method (called 'join') was then used to merge the missing parameters to each US GEOTRACES dataset, most often by matching on sample_GEOTRC or on some unique combination of other parameters.
If the master parameters were included in the original data file and the values did not differ from the master file, the original data columns were retained and the names of the parameters were changed from the PI-submitted names to the standardized master names. If there were differences between the PI-supplied parameter values and those in the master file, both columns were retained. If the original data submission included all of the master parameters, no additional columns were added, but parameter names were modified to match the naming conventions of the master file.
See the dataset parameters documentation for a description of which parameters were supplied by the PI and which were added via the join method.
Corrections:
NOTE: In version 2, the difference b/w PI-provided cast and cast_GEOTRC for samples #6218 to 6225 and for samples #6346 to 6353. (cast numbers are off by 1.). These were changed to agree with Master events.
NOTE: for sample_GEOTRC #6071-6078, changed cast# from 8 to 7 to match Master events [4/22/2013, NJC]
version 4 BCO-DMO Processing:
- Added BCO parameter names to the top.
- Replaced white space cells and NaN's with nd
- Renamed parameters to BCO-DMO standard
- Renamed cruise id's to match standard name: KN199-4 -> KN199-04, KN204-1 -> KN204-01, to facilitate joining columns from Master events.
- The columns are in different order from that served for v3 - used order as submitted for this version
- Reduced significant digits from 14 to 5 for SPM values
- Split isodatetime into date and time and added these two columns.
- Joined columns from Master events to this dataset (station_GEOTRC,cast_GEOTRC,event_GEOTRC,sample_GEOTRC,sample_bottle_GEOTRC,bottle_GEOTRC,depth_GEOTRC_CTD,BTL_ISO_DateTime_UTC)
| File |
|---|
particulates_v5.csv (Comma Separated Values (.csv), 377.79 KB) MD5:a290130d472821964a9eb61e2c72d788 Primary data file for dataset ID 3871 |
| File |
|---|
Lam_GT10-11 - Particulate composition: Table 1 filename: Lam_particulateComp_table1_v3.pdf (Portable Document Format (.pdf), 74.73 KB) MD5:917b16ef947011fafda854baf86733ef Table 1: Dipped (filter) blanks and detection limits for 0.8-51um samples for 142mm filters (nmol/filter) |
Lam_GT10-11 - Particulate composition: Table 2 filename: Lam_reference_recoveries_table2.pdf (Portable Document Format (.pdf), 108.00 KB) MD5:1e1554a99eb081cebd704eb7c17a3d1e Table 2 (PDF): Recoveries for certified reference materials by various labs and digests |
Relationship Description: Dataset 883965, "Compiled Global Dataset of PIC/POC and bSi Concentrations Measured by In Situ Pumps" (contributed by Sijia Dong & Adam Subhas), includes some data from 3871, "GT10-11 - Particulate composition" (contributed by Phoebe Lam).
| Parameter | Description | Units |
| cruise_id | cruise identification | text |
| station_GEOTRC | GEOTRACES station number; ranges from 1 through 12 for KN199-04 and 1 through 24 for KN204-01. Stations 7 and 9 were skipped on KN204-01. PI-supplied values were identical to those in the intermediate US GEOTRACES master file. Originally submitted as 'station'; this parameter name has been changed to conform to BCO-DMO's GEOTRACES naming conventions. | unitless |
| lat | latitude of the shallow pump cast of the station; north is positive | decimal degrees |
| lon | longitude of the shallow pump cast of the station; east is positive | decimal degrees |
| date | date of the midpoint of pumping of the shallow pump cast of the station in the format yyyymmdd | unitless |
| time | time of the midpoint of pumping of the shallow pump cast of the station in the format HHMM | unitless |
| depth_w | depth of the water | meters |
| cast_GEOTRC | cast identifier numbered consecutively within a station. PI-supplied values were identical to those in the intermediate US GEOTRACES master file. Originally submitted as 'cast'; this parameter name has been changed to conform to BCO-DMO's GEOTRACES naming conventions. | integer |
| cast_flag | measurement quality flag | unitless |
| cast_type | 1 is a shallow cast; 2 is a deep cast | integer |
| event_GEOTRC | Unique identifying number for US GEOTRACES sampling events; ranges from 2001 to 2225 for KN199-04 events and from 3001 to 3282 for KN204-01 events. PI-supplied values were identical to those in the intermediate US GEOTRACES master file. Originally submitted as 'event'; this parameter name has been changed to conform to BCO-DMO's GEOTRACES naming conventions. | unitless |
| depth_n | nominal or target depth; not corrected | meters |
| depth_flag | measurement quality flag | unitless |
| depth_sd | standard deviation of depth | meters |
| depth_sd_flag | measurement quality flag | unitless |
| depth_GEOTRC_CTD | depth of pump sample as reported in the intermediate US GEOTRACES master file. Observation/sample depth in meters calculated from CTD pressure. | meters |
| depth_GEOTRC_CTD_round | rounded depth of pump sample to nearest meater. Observation/sample depth in meters calculated from CTD pressure. | meters |
| sample_GEOTRC | Unique identifying number for US GEOTRACES samples; ranges from 5033 to 6078 for KN199-04 and from 6112 to 8148 for KN204-01. PI-supplied values were identical to those in the intermediate US GEOTRACES master file Originally submitted as 'sample'; this parameter name has been changed to conform to BCO-DMO's GEOTRACES naming conventions. | unitless |
| sample_bottle_GEOTRC | Unique identification numbers given to samples taken from bottles; ranges from 1 to 24; often used synonymously with bottle number. Values were added from the intermediate US GEOTRACES master file (see Processing Description). | integer |
| sample_GEOTRC_flag | measurement quality flag | unitless |
| bottle_GEOTRC | Alphanumeric characters identifying bottle type (e.g.; NIS representing Niskin and GF representing GOFLO) and position on a CTD rosette. Values were added from the intermediate US GEOTRACES master file (see Processing Description). | unitless |
| BTL_ISO_DateTime_UTC | Date and time of bottle sample; UTC; ISO formatL yyyy-mm-ddTHH:MM:SS.ssZ | unitless |
| ISO_DateTime_UTC | date and time of the midpoint of pumping of the shallow pump cast of the station. Note that both shallow and deep pump casts were assigned the same date and time stamp to facilitate station recognition in ODV | yyyy-MM-dd'T'HH:mm |
| pump | McLane in-situ pump identifier | unitless |
| pump_flag | measurement quality flag | unitless |
| vol_QMA | volume pumped through the filter holder containing paired QMA filters | liters |
| vol_QMA_flag | measurement quality flag | unitless |
| vol_Supor | volume pumped through the filter holder containing paired Supor filters | liters |
| vol_Supor_flag | measurement quality flag | unitless |
| opal_sink | amorphous/biogenic silica from the sinking size fraction (>51 um) | micrograms/liter |
| opal_sink_flag | measurement quality flag | integer |
| opal_sink_sd | error reported as the 1-sigma variation for amorphous/biogenic silica from the sinking size fraction (>51 um) | micrograms/liter |
| opal_sink_sd_flag | measurement quality flag | integer |
| opal_susp | amorphous/biogenic silica from the suspended size fraction (<51um) | micrograms/liter |
| opal_susp_flag | measurement quality flag | integer |
| opal_susp_sd | error reported as the 1-sigma variation amorphous/biogenic silica from the suspended size fraction (<51um) | micrograms/liter |
| opal_susp_sd_flag | measurement quality flag | integer |
| TPC_sink | total particulate carbon from the sinking size fraction (>51 um) | micrograms/liter |
| TPC_sink_flag | measurement quality flag | integer |
| TPC_sink_sd | error reported as the 1-sigma variation for total particulate carbon from the sinking size fraction (>51um) | micrograms/liter |
| TPC_sink_sd_flag | measurement quality flag | integer |
| TPC_susp | total particulate carbon from the suspended size fraction (<51um) | micrograms/liter |
| TPC_susp_flag | measurement quality flag | integer |
| TPC_susp_sd | error reported as the 1-sigma variation for total particulate carbon from the suspended size fraction (<51um) | micrograms/liter |
| TPC_susp_sd_flag | measurement quality flag | integer |
| PIC_sink | particulate inorganic carbon from the sinking size fraction (>51 um) | micrograms/liter |
| PIC_sink_flag | measurement quality flag | integer |
| PIC_sink_sd | particulate inorganic carbon from the sinking size fraction (>51 um) - 1-sigma variation | micrograms/liter |
| PIC_sink_sd_flag | measurement quality flag | integer |
| PIC_susp_sd | particulate inorganic carbon from the suspended size fraction (<51um)--1 sigma variation. | micrograms/liter |
| PIC_susp_sd_flag | measurement quality flag | integer |
| PIC_susp | particulate inorganic carbon from the suspended size fraction (<51um) | micrograms/liter |
| PIC_susp_flag | measurement quality flag | integer |
| POC_sink | particulate organic carbon from the sinking size fraction (>51 um) | micrograms/liter |
| POC_sink_flag | measurement quality flag | integer |
| POC_sink_sd | error reported as the 1-sigma variation for particulate organic carbon from the sinking size fraction (>51um) | micrograms/liter |
| POC_sink_sd_flag | measurement quality flag | integer |
| POC_susp | particulate organic carbon (POC = TPC - PIC) from the suspended size fraction (<51um) | micrograms/liter |
| POC_susp_flag | measurement quality flag | integer |
| POC_susp_sd | error reported as the 1-sigma variation for particulate organic carbon (POC = TPC - PIC) from the suspended size fraction (<51um) | micrograms/liter |
| POC_susp_sd_flag | measurement quality flag | integer |
| POM_sink | particulate organic matter from the sinking size fraction (>51 um) | micrograms/liter |
| POM_sink_flag | measurement quality flag | integer |
| POM_susp | particulate organic matter from the suspended size fraction (<51um): (POM = POC * 1.88 g POM/g POC) | micrograms/liter |
| POM_susp_flag | measurement quality flag | integer |
| CaCO3_sink | calcium carbonate from the sinking size fraction (>51 um): (CaCO3 = PIC * 100.08 g CaCO3/ 12 g PIC) | micrograms/liter |
| CaCO3_sink_flag | measurement quality flag | integer |
| CaCO3_susp | calcium carbonate from the suspended size fraction (<51um) | micrograms/liter |
| CaCO3_susp_flag | measurement quality flag | integer |
| Litho_AlUCC_sink | alternative lithogenic material for the sinking size fraction (>51um) from Al concentrations and using a UCC Al composition (litho = Al [nM] * 27 g/mol / 0.0804 g Al/g UCC/ 1000 ng/ug) | micrograms/liter |
| Litho_AlUCC_sink_flag | measurement quality flag | integer |
| Litho_AlUCC_sink_sd | error reported as the 1-sigma variation for Litho_AlUCC from the sinking size fraction (>51 um) | micrograms/liter |
| Litho_AlUCC_sink_sd_flag | measurement quality flag | unitless |
| Litho_AlUCC_susp | alternative lithogenic material for the suspended size fraction (<51um) from Al concentrations and using a UCC Al composition (litho = Al [nM] * 27 g/mol / 0.0804 g Al/g UCC/ 1000 ng/ug) | micrograms/liter |
| Litho_AlUCC_susp_flag | measurement quality flag | integer |
| Litho_AlUCC_susp_sd | error reported as the 1-sigma variation for suspended Litho_AlUCC | micrograms/liter |
| Litho_AlUCC_susp_sd_flag | measurement quality flag | unitless |
| Litho_TiDust_sink | lithogenic material from Ti concentrations and using a dust Ti composition - from the sinking size fraction (>51 um) | micrograms/liter |
| Litho_TiDust_sink_flag | measurement quality flag | integer |
| Litho_TiDust_sink_sd | error reported as the 1-sigma variation for lithogenic material from Ti concentrations and using a dust Ti composition from the sinnking size fraction (>51um) | micrograms/liter |
| Litho_TiDust_sink_sd_flag | measurement quality flag | integer |
| Litho_TiDust_susp | lithogenic material from Ti concentrations and using a dust Ti composition from the suspended size fraction (<51um): (litho = Ti [nM] * 47.9 g/mol / 0.006 g Ti/g dust / 1000 ng/ug) | micrograms/liter |
| Litho_TiDust_susp_flag | measurement quality flag | integer |
| Litho_TiDust_susp_sd | error reported as the 1-sigma variation for lithogenic material from Ti concentrations and using a dust Ti composition from the suspended size fraction (<51um) | micrograms/liter |
| Litho_TiDust_susp_sd_flag | measurement quality flag | integer |
| FeOH_3_sink | Fe oxyhydroxides from the sinking size fraction (>51 um): (Fe(OH)3=(Fe [nM]-(Ti[nM]*8.736 nmolFe/nmol Ti[sub-dust]))*106.9 ng Fe(OH)3/nmol Fe/1000) | micrograms/liter |
| FeOH_3_sink_flag | measurement quality flag | integer |
| FeOH_3_sink_sd | error reported as the 1-sigma variation for iron oxyhydroxides from the sinking size fraction (>51um) | micrograms/liter |
| FeOH_3_sink_sd_flag | measurement quality flag | integer |
| FeOH_3_susp | iron oxyhydroxides from the suspended size fraction (<51um) | micrograms/liter |
| FeOH_3_susp_flag | measurement quality flag | integer |
| FeOH_3_susp_sd | error reported as the 1-sigma variation for iron oxyhydroxides from the suspended size fraction (<51um) | micrograms/liter |
| FeOH_3_susp_sd_flag | measurement quality flag | integer |
| MnO2_sink | Mn (oxyhydr)oxides from the sinking size fraction (>51 um): (MnO2=(Mn [nM]-(Ti[nM]*0.1268 nmolFe/nmol Ti[sub-dust]))*86.9 ng MnO2/nmol Mn/1000) | micrograms/liter |
| MnO2_sink_flag | measurement quality flag | integer |
| MnO2_sink_sd | error reported as the 1-sigma variation for Mn (oxyhydr)oxides from the sinking size fraction (>51 um) | micrograms/liter |
| MnO2_sink_sd_flag | measurement quality flag | integer |
| MnO2_susp | manganese (oxyhydr) oxides from the suspended size fraction (<51um) | micrograms/liter |
| MnO2_susp_flag | measurement quality flag | integer |
| MnO2_susp_sd | error reported as the 1-sigma variation for Mn (oxyhydr)oxides from the suspended size fraction (<51 um) | micrograms/liter |
| MnO2_susp_sd_flag | measurement quality flag | integer |
| SPM_sink_sd | suspended particulate material from the sinking size fraction (>51um) | micrograms/liter |
| SPM_sink_sd_flag | measurement quality flag | integer |
| SPM_sink | error reported as the 1-sigma variation for suspended particulate material from the sinking size fraction (>51um) | micrograms/liter |
| SPM_sink_flag | measurement quality flag | integer |
| SPM_susp | suspended particulate material from the suspended size fraction (<51um) (SPM = CaCO3 + opal + POM + Litho_AlUCC + Fe(OH)3_TiDust + MnO2_TiDust) | micrograms/liter |
| SPM_susp_flag | measurement quality flag | integer |
| SPM_susp_sd | error reported as the 1-sigma variation for suspended particulate material from the suspended size fraction (<51um) | micrograms/liter |
| SPM_susp_sd_flag | measurement quality flag | integer |
| Ag_sink | total particulate silver from the sinking size fraction (>51 um) | nanomoles/liter |
| Ag_sink_flag | measurement quality flag | unitless |
| Ag_sink_err | total particulate elemental error reported as the 1-sigma variation of propagated instrumental analytical and standard curve uncertainties and the variation in subtracted dipped blank filters | nanomoles/liter |
| Ag_sink_err_flag | measurement quality flag | integer |
| Ag_susp | total particulate silver from the suspended size fraction (<51um) | nanomoles/liter |
| Ag_susp_flag | measurement quality flag | integer |
| Ag_susp_err | total particulate elemental error reported as the 1-sigma variation of propagated instrumental analytical and standard curve uncertainties and the variation in subtracted dipped blank filters | nanomoles/liter |
| Ag_susp_err_flag | measurement quality flag | integer |
| Al_sink | total particulate aluminium from the sinking size fraction (>51 um) | nanomoles/liter |
| Al_sink_flag | measurement quality flag | integer |
| Al_sink_err | total particulate elemental error reported as the 1-sigma variation of propagated instrumental analytical and standard curve uncertainties and the variation in subtracted dipped blank filters | nanomoles/liter |
| Al_sink_err_flag | measurement quality flag | integer |
| Al_susp | total particulate aluminium from the suspended size fraction (<51um) | nanomoles/liter |
| AL_susp_flag | measurement quality flag | integer |
| Al_susp_err | total particulate elemental error reported as the 1-sigma variation of propagated instrumental analytical and standard curve uncertainties and the variation in subtracted dipped blank filters | nanomoles/liter |
| Al_susp_err_flag | measurement quality flag | integer |
| Ba_sink | total particulate barium from the sinking size fraction (>51 um) | nanomoles/liter |
| Ba_sink_flag | measurement quality flag | integer |
| Ba_sink_err | total particulate elemental error reported as the 1-sigma variation of propagated instrumental analytical and standard curve uncertainties and the variation in subtracted dipped blank filters | nanomoles/liter |
| Ba_sink_err_flag | measurement quality flag | integer |
| Ba_susp | total particulate barium from the suspended size fraction (<51um) | nanomoles/liter |
| Ba_susp_flag | measurement quality flag | integer |
| Ba_susp_err | total particulate elemental error reported as the 1-sigma variation of propagated instrumental analytical and standard curve uncertainties and the variation in subtracted dipped blank filters | nanomoles/liter |
| Ba_susp_err_flag | measurement quality flag | integer |
| Cd_sink | total particulate cadmium from the sinking size fraction (>51 um) | nanomoles/liter |
| Cd_sink_flag | measurement quality flag | integer |
| Cd_sink_err | total particulate elemental error reported as the 1-sigma variation of propagated instrumental analytical and standard curve uncertainties and the variation in subtracted dipped blank filters | nanomoles/liter |
| Cd_sink_err_flag | measurement quality flag | integer |
| Cd_susp | total particulate cadmium from the suspended size fraction (<51um) | nanomoles/liter |
| Cd_susp_flag | measurement quality flag | integer |
| Cd_susp_err | total particulate elemental error reported as the 1-sigma variation of propagated instrumental analytical and standard curve uncertainties and the variation in subtracted dipped blank filters | nanomoles/liter |
| Cd_susp_err_flag | measurement quality flag | integer |
| Co_sink | total particulate cobalt from the sinking size fraction (>51 um) | nanomoles/liter |
| Co_sink_flag | measurement quality flag | integer |
| Co_sink_err | total particulate elemental error reported as the 1-sigma variation of propagated instrumental analytical and standard curve uncertainties and the variation in subtracted dipped blank filters | nanomoles/liter |
| Co_sink_err_flag | measurement quality flag | integer |
| Co_susp | total particulate cobalt from the suspended size fraction (<51um) | nanomoles/liter |
| Co_susp_flag | measurement quality flag | integer |
| Co_susp_err | total particulate elemental error reported as the 1-sigma variation of propagated instrumental analytical and standard curve uncertainties and the variation in subtracted dipped blank filters | nanomoles/liter |
| Co_susp_err_flag | measurement quality flag | integer |
| Cu_sink | total particulate copper from the sinking size fraction (>51 um) | nanomoles/liter |
| Cu_sink_flag | measurement quality flag | integer |
| Cu_sink_err | total particulate elemental error reported as the 1-sigma variation of propagated instrumental analytical and standard curve uncertainties and the variation in subtracted dipped blank filters | nanomoles/liter |
| Cu_sink_err_flag | measurement quality flag | integer |
| Cu_susp | total particulate copper from the suspended size fraction (<51um) | nanomoles/liter |
| Cu_susp_flag | measurement quality flag | integer |
| Cu_susp_err | total particulate elemental error reported as the 1-sigma variation of propagated instrumental analytical and standard curve uncertainties and the variation in subtracted dipped blank filters | nanomoles/liter |
| Cu_susp_err_flag | measurement quality flag | integer |
| Fe_sink | total particulate iron from the sinking size fraction (>51 um) | nanomoles/liter |
| Fe_sink_flag | measurement quality flag | integer |
| Fe_sink_err | total particulate elemental error reported as the 1-sigma variation of propagated instrumental analytical and standard curve uncertainties and the variation in subtracted dipped blank filters | nanomoles/liter |
| Fe_sink_err_flag | measurement quality flag | integer |
| Fe_susp | total particulate iron from the suspended size fraction (<51um) | nanomoles/liter |
| Fe_susp_flag | measurement quality flag | integer |
| Fe_susp_err | total particulate elemental error reported as the 1-sigma variation of propagated instrumental analytical and standard curve uncertainties and the variation in subtracted dipped blank filters | nanomoles/liter |
| Fe_susp_err_flag | measurement quality flag | integer |
| Mn_sink | total particulate manganese from the sinking size fraction (>51 um) | nanomoles/liter |
| Mn_sink_flag | measurement quality flag | integer |
| Mn_sink_err | total particulate elemental error reported as the 1-sigma variation of propagated instrumental analytical and standard curve uncertainties and the variation in subtracted dipped blank filters | nanomoles/liter |
| Mn_sink_err_flag | measurement quality flag | integer |
| Mn_susp | total particulate manganese from the suspended size fraction (<51um) | nanomoles/liter |
| Mn_susp_flag | measurement quality flag | integer |
| Mn_susp_err | total particulate elemental error reported as the 1-sigma variation of propagated instrumental analytical and standard curve uncertainties and the variation in subtracted dipped blank filters | nanomoles/liter |
| Mn_susp_err_flag | measurement quality flag | integer |
| Nd_sink | total particulate neodymium from the sinking size fraction (>51 um) | nanomoles/liter |
| Nd_sink_flag | measurement quality flag | integer |
| Nd_sink_err | total particulate elemental error reported as the 1-sigma variation of propagated instrumental analytical and standard curve uncertainties and the variation in subtracted dipped blank filters | nanomoles/liter |
| Nd_sink_err_flag | measurement quality flag | integer |
| Nd_susp | total particulate neodymium from the suspended size fraction (<51 um) | nanomoles/liter |
| Nd_susp_flag | measurement quality flag | integer |
| Nd_susp_err | total particulate elemental error reported as the 1-sigma variation of propagated instrumental analytical and standard curve uncertainties and the variation in subtracted dipped blank filters | nanomoles/liter |
| Nd_susp_err_flag | measurement quality flag | integer |
| Ni_sink | total particulate nickel from the sinking size fraction (>51 um) | nanomoles/liter |
| Ni_sink_flag | measurement quality flag | integer |
| Ni_sink_err | total particulate elemental error reported as the 1-sigma variation of propagated instrumental analytical and standard curve uncertainties and the variation in subtracted dipped blank filters | nanomoles/liter |
| Ni_sink_err_flag | measurement quality flag | integer |
| Ni_susp | total particulate nickel from the suspended size fraction (<51um) | nanomoles/liter |
| Ni_susp_flag | measurement quality flag | integer |
| Ni_susp_err | total particulate elemental error reported as the 1-sigma variation of propagated instrumental analytical and standard curve uncertainties and the variation in subtracted dipped blank filters | nanomoles/liter |
| Ni_susp_err_flag | measurement quality flag | integer |
| P_sink | total particulate phosphorus from the sinking size fraction (>51 um) | nanomoles/liter |
| P_sink_flag | measurement quality flag | integer |
| P_sink_err | total particulate elemental error reported as the 1-sigma variation of propagated instrumental analytical and standard curve uncertainties and the variation in subtracted dipped blank filters | nanomoles/liter |
| P_sink_err_flag | measurement quality flag | integer |
| P_susp | total particulate phosphorus from the suspended size fraction (<51um) | nanomoles/liter |
| P_susp_flag | measurement quality flag | integer |
| P_susp_err | total particulate elemental error reported as the 1-sigma variation of propagated instrumental analytical and standard curve uncertainties and the variation in subtracted dipped blank filters | nanomoles/liter |
| P_susp_err_flag | measurement quality flag | integer |
| Pb_sink | total particulate lead from the sinking size fraction (>51 um) | nanomoles/liter |
| Pb_sink_flag | measurement quality flag | integer |
| Pb_sink_err | total particulate elemental error reported as the 1-sigma variation of propagated instrumental analytical and standard curve uncertainties and the variation in subtracted dipped blank filters | nanomoles/liter |
| Pb_sink_err_flag | measurement quality flag | integer |
| Pb_susp | total particulate lead from the suspended size fraction (<51um) | nanomoles/liter |
| Pb_susp_flag | measurement quality flag | integer |
| Pb_susp_err | total particulate elemental error reported as the 1-sigma variation of propagated instrumental analytical and standard curve uncertainties and the variation in subtracted dipped blank filters | nanomoles/liter |
| Pb_susp_err_flag | measurement quality flag | integer |
| Th_sink | total particulate thorium from the sinking size fraction (>51 um) | nanomoles/liter |
| Th_sink_flag | measurement quality flag | integer |
| Th_sink_err | total particulate elemental error reported as the 1-sigma variation of propagated instrumental analytical and standard curve uncertainties and the variation in subtracted dipped blank filters | nanomoles/liter |
| Th_sink_err_flag | measurement quality flag | integer |
| Th_susp | total particulate thorium from the suspended size fraction (<51um) | nanomoles/liter |
| Th_susp_flag | measurement quality flag | integer |
| Th_susp_err | total particulate elemental error reported as the 1-sigma variation of propagated instrumental analytical and standard curve uncertainties and the variation in subtracted dipped blank filters | nanomoles/liter |
| Th_susp_err_flag | measurement quality flag | integer |
| Ti_sink | total particulate titanium from the sinking size fraction (>51 um) | nanomoles/liter |
| Ti_sink_flag | measurement quality flag | integer |
| Ti_sink_err | total particulate elemental error reported as the 1-sigma variation of propagated instrumental analytical and standard curve uncertainties and the variation in subtracted dipped blank filters | nanomoles/liter |
| Ti_sink_err_flag | measurement quality flag | integer |
| Ti_susp | total particulate titanium from the suspended size fraction (<51um) | nanomoles/liter |
| Ti_susp_flag | measurement quality flag | integer |
| Ti_susp_err | total particulate elemental error reported as the 1-sigma variation of propagated instrumental analytical and standard curve uncertainties and the variation in subtracted dipped blank filters | nanomoles/liter |
| Ti_susp_err_flag | measurement quality flag | integer |
| V_sink | total particulate vanadium from the sinking size fraction (>51 um) | nanomoles/liter |
| V_sink_flag | measurement quality flag | integer |
| V_sink_err | total particulate elemental error reported as the 1-sigma variation of propagated instrumental analytical and standard curve uncertainties and the variation in subtracted dipped blank filters | nanomoles/liter |
| V_sink_err_flag | measurement quality flag | integer |
| V_susp | total particulate vanadium from the suspended size fraction (<51um) | nanomoles/liter |
| V_susp_flag | measurement quality flag | integer |
| V_susp_err | total particulate elemental error reported as the 1-sigma variation of propagated instrumental analytical and standard curve uncertainties and the variation in subtracted dipped blank filters | nanomoles/liter |
| V_susp_err_flag | measurement quality flag | integer |
| Y_sink | total particulate yttrium from the sinking size fraction (>51 um) | nanomoles/liter |
| Y_sink_flag | measurement quality flag | integer |
| Y_sink_err | total particulate elemental error reported as the 1-sigma variation of propagated instrumental analytical and standard curve uncertainties and the variation in subtracted dipped blank filters | nanomoles/liter |
| Y_sink_err_flag | measurement quality flag | integer |
| Y_susp | total particulate yttrium from the suspended size fraction (<51um) | nanomoles/liter |
| Y_susp_flag | measurement quality flag | integer |
| Y_susp_err | total particulate elemental error reported as the 1-sigma variation of propagated instrumental analytical and standard curve uncertainties and the variation in subtracted dipped blank filters | nanomoles/liter |
| Y_susp_err_flag | measurement quality flag | integer |
| Zn_sink | total particulate zinc from the sinking size fraction (>51 um) | nanomoles/liter |
| Zn_sink_flag | measurement quality flag | integer |
| Zn_sink_err | total particulate elemental error reported as the 1-sigma variation of propagated instrumental analytical and standard curve uncertainties and the variation in subtracted dipped blank filters | nanomoles/liter |
| Zn_sink_err_flag | measurement quality flag | integer |
| Zn_susp | total particulate zinc from the suspended size fraction (<51um) | nanomoles/liter |
| Zn_susp_flag | measurement quality flag | integer |
| Zn_susp_err | total particulate elemental error reported as the 1-sigma variation of propagated instrumental analytical and standard curve uncertainties and the variation in subtracted dipped blank filters | nanomoles/liter |
| Zn_susp_err_flag | measurement quality flag | integer |
| Dataset-specific Instrument Name | CTD Sea-Bird |
| Generic Instrument Name | CTD Sea-Bird |
| Dataset-specific Description | A self-recording Seabird 19plus CTD, deployed at the end of the line for both cruises. |
| Generic Instrument Description | A Conductivity, Temperature, Depth (CTD) sensor package from SeaBird Electronics. This instrument designation is used when specific make and model are not known or when a more specific term is not available in the BCO-DMO vocabulary. Refer to the dataset-specific metadata for more information about the specific CTD used. More information from: http://www.seabird.com/ |
| Dataset-specific Instrument Name | Element 2, Thermo-Finnigan |
| Generic Instrument Name | Inductively Coupled Plasma Mass Spectrometer |
| Dataset-specific Description | Used to measure particulate inorganic carbon (PIC) and particulate trace metals (pTM). Instruments were located at WHOI and Boston University. |
| Generic Instrument Description | An ICP Mass Spec is an instrument that passes nebulized samples into an inductively-coupled gas plasma (8-10000 K) where they are atomized and ionized. Ions of specific mass-to-charge ratios are quantified in a quadrupole mass spectrometer. |
| Dataset-specific Instrument Name | McLane Pump |
| Generic Instrument Name | McLane Pump |
| Dataset-specific Description | Modified to accommodate two flowpaths (Lam and Morris Patent pending). Typically, two casts of 8 pumps each and two filter holders per pump were deployed to collect a 16-depth profile.
Lam, P. J., and P. J. Morris. Patent pending. In situ marine sample collection system and methods. Application No. 13/864,655. |
| Generic Instrument Description | McLane pumps sample large volumes of seawater at depth. They are attached to a wire and lowered to different depths in the ocean. As the water is pumped through the filter, particles suspended in the ocean are collected on the filters. The pumps are then retrieved and the contents of the filters are analyzed in a lab. |
| Dataset-specific Instrument Name | Flash EA1112 Carbon/Nitrogen Analyzer |
| Generic Instrument Name | Particulate Organic Carbon/Nitrogen Analyzer |
| Dataset-specific Description | Used to measure total particulate carbon. |
| Generic Instrument Description | A unit that accurately determines the carbon and nitrogen concentrations of organic compounds typically by detecting and measuring their combustion products (CO2 and NO). |
KN199-04
| Website | |
| Platform | R/V Knorr |
| Report | |
| Start Date | 2010-10-15 |
| End Date | 2010-11-04 |
| Description | This cruise constitutes the first survey section as part of the U.S. participation in an international program named GEOTRACES.
Funding: NSF OCE award 0926423
Science Objectives: To obtain state of the art trace metal and isotope measurements on a suite of samples taken on a mid-latitude zonal transect of the North Atlantic. In particular, sampling targeted the oxygen minimum zone extending off the west African coast near Mauritania, the TAG hydrothermal field, and the western boundary current system along Line W. For additional information, please refer to the GEOTRACES program Web site (https://www.geotraces.org/) for overall program objectives and a summary of properties measured.
Science Activities include seawater sampling via GoFLO and Niskin carousels, in situ pumping (and filtration), CTDO2 and transmissometer sensors, underway pumped sampling of surface waters, and collection of aerosols and rain. Hydrography, CTD and nutrient measurements were supported by the Ocean Data Facility (J. Swift) at Scripps Institution of Oceanography and funded through NSF Facilities. They provided an additional CTD rosette system along with nephelometer and LADCP. A trace metal clean Go-Flo Rosette and winch were provided by the group at Old Dominion University (G. Cutter) along with a towed underway pumping system.
Additional cruise information is available from the Rolling Deck to Repository (R2R): https://www.rvdata.us/search/cruise/KN199-04
Other Relevant Links:
List of cruise participants: [ PDF ]
Cruise track: JPEG image (from Woods Hole Oceanographic Institution, vessel operator)
ADCP data are available from the Currents ADCP group at the University of Hawaii: KN199-04 ADCP |
KN204-01
| Website | |
| Platform | R/V Knorr |
| Report | |
| Start Date | 2011-11-06 |
| End Date | 2011-12-11 |
| Description | The US GEOTRACES North Atlantic cruise aboard the R/V Knorr completed the section between Lisbon and Woods Hole that began in October 2010 but was rescheduled for November-December 2011. The R/V Knorr made a brief stop in Bermuda to exchange samples and personnel before continuing across the basin. Scientists disembarked in Praia, Cape Verde, on 11 December. The cruise was identified as KN204-01A (first part before Bermuda) and KN204-01B (after the Bermuda stop). However, the official deployment name for this cruise is KN204-01 and includes both part A and B.
Science activities included: ODF 30 liter rosette CTD casts, ODU Trace metal rosette CTD casts, McLane particulate pump casts, underway sampling with towed fish and sampling from the shipboard "uncontaminated" flow-through system.
Full depth stations are shown in the accompanying figure (see below). Additional stations to sample for selected trace metals to a depth of 1000 m are not shown. Standard stations are shown in red (as are the ports) and "super" stations, with extra casts to provide large-volume samples for selected parameters, are shown in green.
Station spacing is concentrated along the western margin to evaluate the transport of trace elements and isotopes by western boundary currents. Stations across the gyre will allow scientists to examine trace element supply by Saharan dust, while also contrasting trace element and isotope distributions in the oligotrophic gyre with conditions near biologically productive ocean margins, both in the west, to be sampled now, and within the eastern boundary upwelling system off Mauritania, sampled last year.
Funding: The cruise was funded by NSF OCE awards 0926204, 0926433 and 0926659.
Additional cruise information is available from the Rolling Deck to Repository (R2R): https://www.rvdata.us/search/cruise/KN204-01
Other Relevant Links:
ADCP data are available from the Currents ADCP group at the University of Hawaii at the links below:
KN204-01A (part 1 of 2011 cruise; Woods Hole, MA to Bermuda)
KN204-01B (part 2 of 2011 cruise; Bermuda to Cape Verde) |
U.S. GEOTRACES North Atlantic Transect (GA03) (U.S. GEOTRACES NAT)
Much of this text appeared in an article published in OCB News, October 2008, by the OCB Project Office.
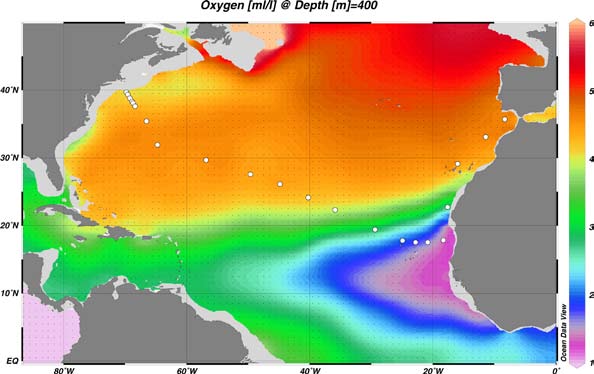
The first U.S. GEOTRACES Atlantic Section will be specifically centered around a sampling cruise to be carried out in the North Atlantic in 2010. Ed Boyle (MIT) and Bill Jenkins (WHOI) organized a three-day planning workshop that was held September 22-24, 2008 at the Woods Hole Oceanographic Institution. The main goal of the workshop, sponsored by the National Science Foundation and the U.S. GEOTRACES Scientific Steering Committee, was to design the implementation plan for the first U.S. GEOTRACES Atlantic Section. The primary cruise design motivation was to improve knowledge of the sources, sinks and internal cycling of Trace Elements and their Isotopes (TEIs) by studying their distributions along a section in the North Atlantic (Figure 1). The North Atlantic has the full suite of processes that affect TEIs, including strong meridional advection, boundary scavenging and source effects, aeolian deposition, and the salty Mediterranean Outflow. The North Atlantic is particularly important as it lies at the "origin" of the global Meridional Overturning Circulation.
It is well understood that many trace metals play important roles in biogeochemical processes and the carbon cycle, yet very little is known about their large-scale distributions and the regional scale processes that affect them. Recent advances in sampling and analytical techniques, along with advances in our understanding of their roles in enzymatic and catalytic processes in the open ocean provide a natural opportunity to make substantial advances in our understanding of these important elements. Moreover, we are motivated by the prospect of global change and the need to understand the present and future workings of the ocean's biogeochemistry. The GEOTRACES strategy is to measure a broad suite of TEIs to constrain the critical biogeochemical processes that influence their distributions. In addition to these "exotic" substances, more traditional properties, including macronutrients (at micromolar and nanomolar levels), CTD, bio-optical parameters, and carbon system characteristics will be measured. The cruise starts at Line W, a repeat hydrographic section southeast of Cape Cod, extends to Bermuda and subsequently through the North Atlantic oligotrophic subtropical gyre, then transects into the African coast in the northern limb of the coastal upwelling region. From there, the cruise goes northward into the Mediterranean outflow. The station locations shown on the map are for the "fulldepth TEI" stations, and constitute approximately half of the stations to be ultimately occupied.
Figure 1. The proposed 2010 Atlantic GEOTRACES cruise track plotted on dissolved oxygen at 400 m depth. Data from the World Ocean Atlas (Levitus et al., 2005) were plotted using Ocean Data View (courtesy Reiner Schlitzer). [click on the image to view a larger version]
Hydrography, CTD and nutrient measurements will be supported by the Ocean Data Facility (J. Swift) at Scripps Institution of Oceanography and funded through NSF Facilities. They will be providing an additional CTD rosette system along with nephelometer and LADCP. A trace metal clean Go-Flo Rosette and winch will be provided by the group at Old Dominion University (G. Cutter) along with a towed underway pumping system.
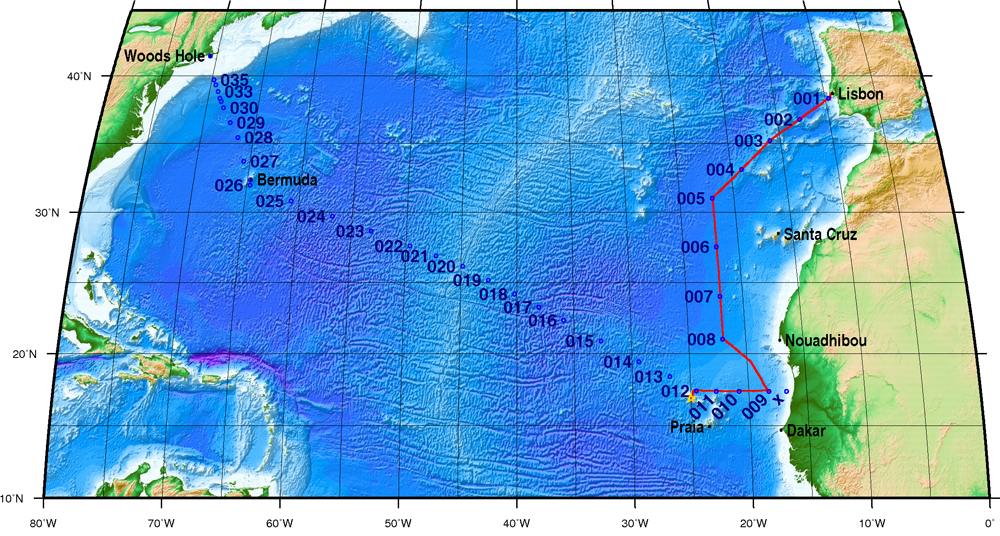
The North Atlantic Transect cruise began in 2010 with KN199 leg 4 (station sampling) and leg 5 (underway sampling only) (Figure 2).
Figure 2. The red line shows the cruise track for the first leg of the US Geotraces North Atlantic Transect on the R/V Knorr in October 2010. The rest of the stations (beginning with 13) will be completed in October-December 2011 on the R/V Knorr (courtesy of Bill Jenkins, Chief Scientist, GNAT first leg). [click on the image to view a larger version]
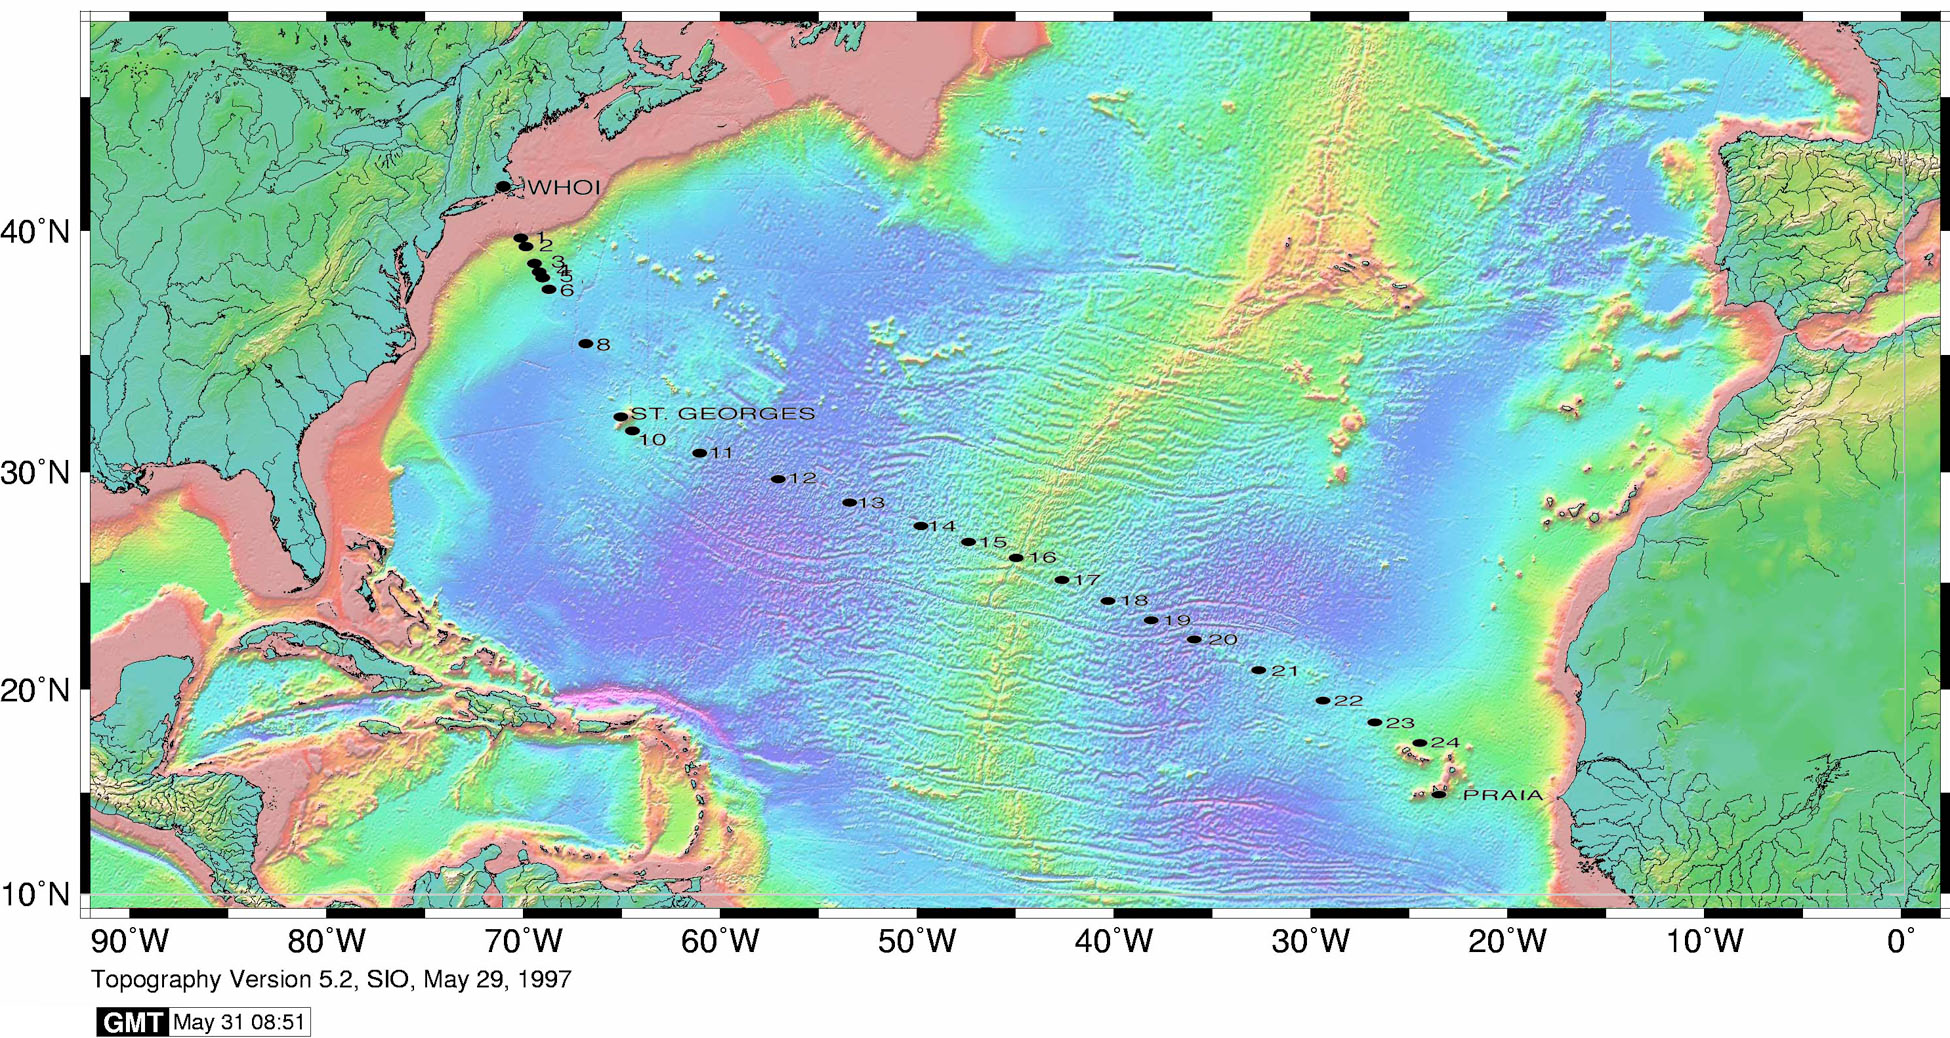
The section completion effort resumed again in November 2011 with KN204-01A,B (Figure 3).
KN204-01A,B Cruise Report (PDF)
Figure 3. Station locations occupied on the US Geotraces North Atlantic Transect on the R/V Knorr in November 2011. [click on the image to view a larger version]
Data from the North Atlantic Transect cruises are available under the Datasets heading below, and consensus values for the SAFe and North Atlantic GEOTRACES Reference Seawater Samples are available from the GEOTRACES Program Office: Standards and Reference Materials
ADCP data are available from the Currents ADCP group at the University of Hawaii at the links below:
KN199-04 (leg 1 of 2010 cruise; Lisbon to Cape Verde)
KN199-05 (leg 2 of 2010 cruise; Cape Verde to Charleston, NC)
KN204-01A (part 1 of 2011 cruise; Woods Hole, MA to Bermuda)
KN204-01B (part 2 of 2011 cruise; Bermuda to Cape Verde)
U.S. GEOTRACES (U.S. GEOTRACES)
GEOTRACES is a SCOR sponsored program; and funding for program infrastructure development is provided by the U.S. National Science Foundation.
GEOTRACES gained momentum following a special symposium, S02: Biogeochemical cycling of trace elements and isotopes in the ocean and applications to constrain contemporary marine processes (GEOSECS II), at a 2003 Goldschmidt meeting convened in Japan. The GEOSECS II acronym referred to the Geochemical Ocean Section Studies To determine full water column distributions of selected trace elements and isotopes, including their concentration, chemical speciation, and physical form, along a sufficient number of sections in each ocean basin to establish the principal relationships between these distributions and with more traditional hydrographic parameters;
* To evaluate the sources, sinks, and internal cycling of these species and thereby characterize more completely the physical, chemical and biological processes regulating their distributions, and the sensitivity of these processes to global change; and
* To understand the processes that control the concentrations of geochemical species used for proxies of the past environment, both in the water column and in the substrates that reflect the water column.
GEOTRACES will be global in scope, consisting of ocean sections complemented by regional process studies. Sections and process studies will combine fieldwork, laboratory experiments and modelling. Beyond realizing the scientific objectives identified above, a natural outcome of this work will be to build a community of marine scientists who understand the processes regulating trace element cycles sufficiently well to exploit this knowledge reliably in future interdisciplinary studies.
Expand "Projects" below for information about and data resulting from individual US GEOTRACES research projects.
| Funding Source | Award |
|---|---|
| NSF Division of Ocean Sciences (NSF OCE) |
[ table of contents | back to top ]