Size-fractionated major and minor particle composition and concentration collected from RV Thompson (TN303) along the US GEOTRACES EPZT transect in the Eastern Tropical Pacific during 2013 (US GEOTRACES EPZT project)
Project
Program
| Contributors | Affiliation | Role |
|---|---|---|
| Lam, Phoebe J. | University of California-Santa Cruz (UCSC) | Principal Investigator, Contact |
| Carney, Colin | University of California-Santa Cruz (UCSC) | Analyst |
| Heller, Maija I. | Ifremer (Ifremer) | Analyst |
| Henderson, Paul B. | Woods Hole Oceanographic Institution (WHOI) | Analyst |
| Kakou, Ulrich | University of Massachusetts Amherst | Analyst |
| Lee, Jong-Mi | University of California-Santa Cruz (UCSC) | Analyst |
| Manganini, Steven | Woods Hole Oceanographic Institution (WHOI) | Analyst |
| Mehic, Sanjin | University of California-Santa Cruz (UCSC) | Analyst |
| Xiang, Yang | University of California-Santa Cruz (UCSC) | Analyst |
| Ake, Hannah | Woods Hole Oceanographic Institution (WHOI BCO-DMO) | BCO-DMO Data Manager |
Abstract
Size-fractionated major and minor particle composition and concentration.
1. Sampling:
Size-fractionated particles were collected using McLane Research in-situ pumps (WTS-LV) that had been modified to accommodate two flowpaths (Ohnemus and Lam, 2015). Typically, two casts of 8 pumps each and two filter holders per pump were deployed to collect a 16-depth profile. At superstations, three casts were deployed to collect a 24-depth profile. The wire-out was used to target nominal depths during deployment. A self-recording Seabird 19plus CTD was deployed at the end of the line and used to verify target depths.
Filter holders used were 142 mm-diameter “mini-MULVFS” style filter holders with two stages for two size fractions and multiple baffle systems designed to ensure even particle distribution and prevent particle loss (Bishop et al., 2012). One filter holder/flowpath was loaded with a 51um Sefar polyester mesh prefilter followed by paired Whatman QMA quartz fiber filters. The other filter holder/flowpath was also loaded with a 51um prefilter, but followed by paired 0.8um Pall Supor800 polyethersulfone filters. All filters and filter holders were acid leached prior to use according to methods recommended in the GEOTRACES sample and sample-handing Protocols (GEOTRACES, 2010). QMA filters were additionally precombusted at 450 deg C for four hours.
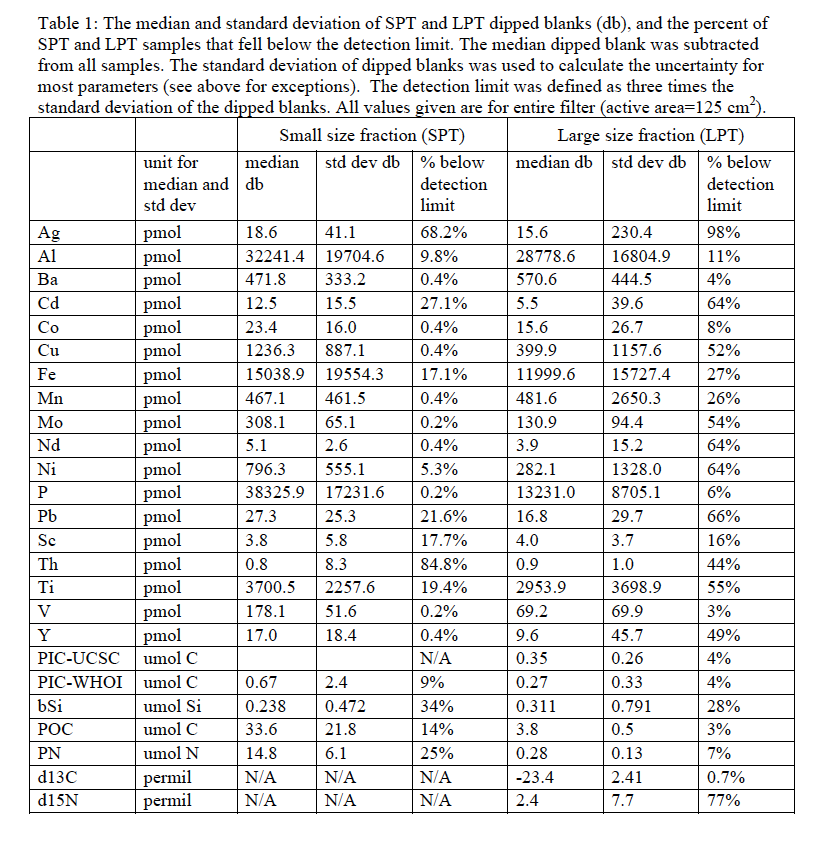
Each cast also had a full set of “dipped blank” filters deployed. In the first half of the cruise, these were the full filters sets (51 um prefilter followed by paired QMA or paired Supor filters) loaded in mini-MULVFS filter holders that were mounted on a pump with a specially designed dipped blank plate to accommodate two extra filter holders not connected to the pump. A 0.2 um Supor prefilter above the filter set excluded any particles that may have been present in seawater in the filter holder headspace. At station 21, the specially designed plate (along with the filter holders) was lost at sea when the ship lost power, so subsequent dipped blank filters were the full filter sets sandwiched within a 1um polyester mesh filter, loaded into acid-leached perforated polypropylene containers, and attached with plastic cable ties to a pump frame, and deployed. All dipped blank filters were exposed to seawater for the length of the deployment and processed and analyzed as regular samples, and thus functioned as full seawater process blanks. A total of 58 dipped blank filter sets were collected and used for blank subtraction and determination of uncertainty and detection limit (Table 1).
In this dataset, data reported from the 51um prefilter are referred to with a LPT suffix to indicate large particulate total concentrations (>51um); data reported from the main filters (QMA—1-51um—or Supor—0.8 um-51um) are from the top filter of the pair only, and are referred to with a SPT suffix to indicate the small particulate total concentrations.
2. Analytical Methodology and Data Processing:
For all parameters described below, the median dipped blank value (Table 1) was subtracted. For most parameters, we could not routinely run replicates, so the reported error is determined from the standard deviation of dipped blank filters (Table 1), converted to concentrations using volume filtered. This assumes that the blank subtraction is the largest source of error. The detection limit was defined as three times the standard deviation of the dipped blank filters. Values below the detection limit were flagged as QF=4. The percentage of all samples that fell below the detection limit is listed in Table 1 for each parameter and size fraction. Any variations on the methods for blank subtraction or determination of error are further described for each parameter, as necessary.
2.1. Biogenic Silica and Opal
2.1.1 Analytical methodology for biogenic silica
A 1/16 subsample of the top 0.8um Supor filter, equivalent to ~30L, or of the 51um polyester prefilter above the QMA filter, equivalent to ~60L, was analyzed for amorphous/biogenic Si concentrations using spectrophotometric detection of the blue silico-molydate complex following an alkaline (0.2M NaOH) leach at 85 deg C. Some initial stations were run manually on a Shimadzu UV-2550 UV-VIS Spectrophotometer at WHOI, but most samples were run on a Lachat QuikChem 8000 Flow Injection Analyzer at UCSC. The principle of both methods is the same, except that formation of the silico-molybdate complex reaction is allowed to run to completion before spectrophotometric detection in the manual method (WHOI), whereas the reaction occurs online in the flow injection method (UCSC).
A time-series approach was tested for the WHOI leaches, with four timepoints taken after 1, 2, 3, and 4 hours of leaching. There was little evidence of a systematic lithogenic contribution, so the mean of the first three timepoints from the WHOI leaches was taken as the most representative value, and the standard deviation used in the error estimate. Subsequent samples at UCSC were leached for 1 hr only.
2.1.2 Data Processing
Intercomparability of the WHOI and UCSC methods was assessed by checking that the bSi profiles of stations with samples analyzed at both places were oceanographically consistent.
The median of Supor dipped blank filters were used to correct the SPT data. For >51 um LPT samples on polyester prefilters, blank corrections were made using the median failed pump values (pumps that never turned on, or that shut off after <5% of programmed water volume was filtered) because of anomalously high prefilter dipped blank values. Anomalously high prefilter dipped blank bSi values was also observed for the GA03 NAZT section.
The reported error was determined as the standard deviation of bSi on the dipped blank filters, converted to concentrations using volume filtered. For samples run at WHOI only, the standard deviation of the three timepoints was also propagated into the error estimate.
2.1.3 Derived parameters: OPAL
The mass of opal was calculated assuming a hydrated form of silica: SiO2.(0.4 H2O) (Mortlock and Froelich, 1989), or 67.2 g opal/mol bSi:
OPAL [ug/L] = bSi [uM] *67.2 [ug opal/umol bSi]
2.2 Particulate Organic Carbon (POC), Particulate Nitrogen (PN), POM, δ13C, and d15N
2.2.1 Analytical methodology for POC, PN, δ13C, and d15N
Particulate organic carbon and particulate nitrogen were measured by combustion on an elemental analyzer after fuming with concentrated HCl to remove particulate inorganic carbon. Briefly, dried filter samples were exposed to HCl fumes in a dessicator for ~16 hours. After fuming, filters were dried at 60 deg C in an oven for another ~16 hrs before being pelletized in tin discs. POC from suspended particles (1-51um; SPT) were measured using a Flash EA1112 Carbon/Nitrogen Analyzer using a Dynamic Flash Combustion technique at the WHOI Nutrient Analytical Facility on two 12 mm-diameter punches from the top QMA filter, representing the equivalent of ~20L of material. For the >51um size fraction (LPT), particles from the 51um polyester prefilter above the Supor filter were rinsed at sea with 1um-filtered seawater onto a 25mm 1.2 um Sterlitech Ag filter and dried at 60 deg C. Half of the Ag filter containing rinsed LPT particles, typically representing ~200L of material, was analyzed for POC and PN using either a Carlo Erba 1108 or a CE Instruments NC2500 elemental analyzer interfaced to a ThermoFinnigan Delta Plus XP isotope ratio mass spectrometer at the Stable Isotope Laboratory at UCSC, which also gave the C and N stable isotope composition of the LPT particles.
2.2.2 Data Processing
Intercomparability of the WHOI and UCSC datasets was assessed by checking that a POC_SPT profile that had samples analyzed at both places was oceanographically consistent.
For POC and PN in the small size fraction, the standard deviation of 47 dipped blank QMA filters used for blank subtraction. For POC and PN in the large size fractions (>51 um; POC_LPT, PN_LPT), we found that the variability in the dipped blank increased significantly after station 21 (i.e., after the loss of the dipped blank plate and switching to the perforated plastic holder for the dipped blanks), especially for the deeper casts. We therefore use the median and standard deviation of 25 dipped blanks from before station 21 for blank subtraction and error estimation (Table 1).
The stable isotopic composition of C (δ13C) and N (d15N ) for the large size fraction LPT particles are given as raw values (*_raw), and corrected for the dipped blank (*_dbcorr) using the median isotopic composition of the dipped blanks (Table 1). Measurement precision is 0.2 permil for samples greater than 20 mg C (1.7 mmol C) or 20 mg N (1.4 mmol N). Only three samples did not meet this threshold for LPT C, but 77% of LPT samples did not meet this threshold for N. d15N values for samples below the 20 mg N threshold were assigned a QF=4.
2.2.3 Derived parameters: POM
Particulate organic matter (POM) is calculated from POC using a weight ratio of 1.88 g POM/g POC (Lam et al., 2011).
POM [mg/L] = POC [mM] * 12 [mg POC/mmol POC] * 1.88 [g POM/g POC]
2.3 Particulate Inorganic Carbon (PIC) and CaCO3
2.3.1 Analytical methodology for PIC
PIC was measured directly by coulometry (measurement of CO2 following closed-system conversion of PIC to CO2 upon addition of 1N phosphoric acid (WHOI) or 2 N sulfuric acid (UCSC) to a QMA punch or 1/16 polyester prefilter) (Honjo et al., 1995)
2.3.2 Data Processing
Intercomparability of the WHOI and UCSC datasets was assessed by checking that a PIC_LPT profile that had samples analyzed at both places was oceanographically consistent. Blank subtraction, error calculation, and detection limit determined as described at beginning of section 2.
2.3.3 Derived parameters: CaCO3
The mass of CaCO3 is calculated stoichiometrically from the mass of PIC:
CaCO3 [ug/L] = PIC [umol/L] * 100.08 [mg CaCO3/mmol PIC]
2.4 Particulate trace metals (pTM)
2.4.1 Analytical methodology for pTMs
Total pTM concentrations in the SPT were analyzed from either 1/16 or 1/8 subsamples of the top Supor (0.8um) filter. pTM totals in the LPT were analyzed from 1/8 subsamples (typically ~150L) of the QMA-side 51um pre-filter, which were rinsed at sea onto 25mm Supor (0.8um) filter discs using 0.2um-filtered surface seawater collected using clean techniques from an underway Fish system (Bruland et al., 2005). Methods for particulate trace metal (pTM) digestion and analysis followed those described in (Ohnemus and Lam, 2015). Briefly, the Supor filter matrix was first completely digested with the strongly oxidizing Piranha solution, a 3:1 mixture of sulfuric acid and hydrogen peroxide with 1 ppb Rh as a recovery monitor. After drying down, remaining particles were digested in a mixture of HCl/HNO3/HF acids (all acids at 4 M) at 135˚C for 4 hrs, then dried down. Remaining pellet was reacted with 50% HNO3/15% H2O2 to remove any remaining organics, dried, and resuspended in 5% HNO3 with 1 ppb In as an internal standard for analysis via high-resolution Inductively Coupled Mass Spectrometetry (HR-ICP-MS) using an Element-XR ICP-MS (Thermo Scientific) with SC-FAST (Elemental Scientific) sample introduction system and PC3 Peltier cooled quartz cyclonic spray chamber in the UCSC Plasma Analytical Facility. ICP-MS (Element XR, Thermo-Finnigan). Elemental concentrations were standardized using multi-element, external standard curves prepared from NIST atomic absorption-standards in 5% HNO3. Instrument drift and matrix effects were corrected using the internal 1ppb In standard and monitored using a mixed element run standard. Concentrations were determined using external standard curves of mixed trace elements standards.
A subset of samples were repeated in which samples were redigested and/or rerun.
2.4.2 Data processing
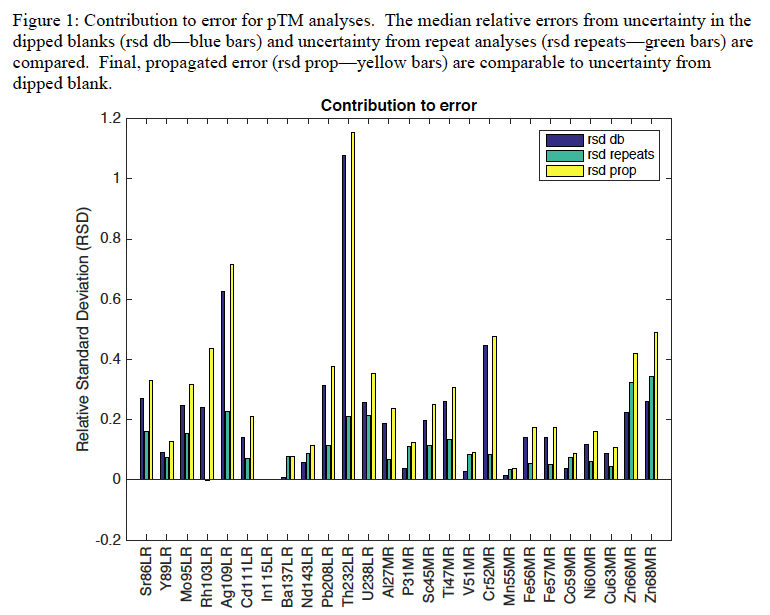
The reported error is calculated by propagating the two main sources of uncertainty: uncertainty in the dipped blank subtraction, and the combined uncertainty due to heterogeneity in particle distribution and variations in digestion. The former is determined as the standard deviation of the dipped blank filters. The latter is determined from the maximum of the mean relative standard deviation of all repeat samples for that element if no repeats were run, and the actual standard deviation if repeats were run. For most elements, the uncertainty in the blank subtraction was the largest source of uncertainty (Figure 1).
2.4.3 Derived parameters
2.4.3.1 Lithogenic material
Al is usually used as a tracer of lithogenic material since it is the third most abundant element in Earth’s crust after Si and O. Al has the added advantage that its concentration does not vary much between upper continental crust (UCC Al = 8.04% by weight) and bulk continental crust (BCC Al = 8.41wt%), so the estimate of lithogenic mass is not very sensitive to lithogenic source regions (Taylor and McLennan, 1995). Slopes of Fe vs Al (10.3 mol Fe/mol Al) and Fe vs Ti (0.23 mol Fe/mol Ti) for samples dominated by lithogenic material (Station 1 trench) gave slopes that were very similar to UCC crustal ratios (Fe/AlUCC=10.0 and Fe/TiUCC-0.21; compare to Fe/AlBCC=11.2 and Fe/TiBCC-0.41). We therefore use the UCC Al concentration of 8.04% to calculate lithogenic mass.
LITHO [ug/L] = Al [pM] * 27 [pg/pmol] / 0.0804 [ug Al/mg UCC] * [1ug/1e6 pg]
2.4.3.2 Fe and Mn oxyhydroxides
Fe and Mn in oxyhydroxides were calculated by subtracting Fe and Mn associated with lithogenic material. Although Ti may be a better tracer for lithogenic Fe and Mn than Al as the ratios of Fe and Mn to Ti are less sensitive to source than ratios to Al (Lam et al., 2015), Ti concentrations were very low and often below the detection limit for this transect. We verified that the UCC Fe:Al=0.210 mol/mol and Mn:Al=0.00355 mol/mol ratios (Taylor and McLennan, 1995) compared well with Fe:Al in the most lithogenic-rich sample in our dataset—the deepest samples in the Peru Trench, which had Fe:Al=0.227. We thus used the UCC ratios of Fe and Mn to Al to remove lithogenic Fe and Mn, We approximate the formulae for Fe and Mn oxyhydroxides to be Fe(OH)3 (ferrihydrite approximation) and MnO2 (birnessite approximation), with formula weights 106.9 g Fe(OH)3/mol Fe and 86.9 g MnO2/mol Mn, respectively. Negative numbers were set to 0.
FeOH3 [ug/L] = (Fe [pM] – (Al [pM] * 0.210 [pmol Fe/pmol Al]) ) * 106.9 [pg Fe(OH)3/ pmol Fe] * [1ug/1e6 pg])
MnO2 [ug/L] = (Mn [pM] – (Al [pM] * 0.00367 [pmol Mn/pmol Al]) ) *
86.9 [pg MnO2/pmol Mn] * [1ug/1e6 pg])
2.5 Suspended particulate mass (SPM)
Suspended particulate mass in the sinking (>51um) and suspended (1-51um) size fractions was estimated as the chemical dry weight of the major particulate phases, which is the sum of POM, opal, CaCO3, lithogenic material, and Fe and Mn oxyhydroxides, and is calculated as:
SPM [mg/L] = POM [ug/L] + opal [ug/L] + CaCO3 [ug/L] + Litho [ug/L] + Fe(OH)3 [ug/L] + MnO2 [ug/L]
Note that the resolution of this data is dictated by the lowest resolution of the component parts.
Blank corrections, error calculations, and detection limits are described above with analytical methodology.
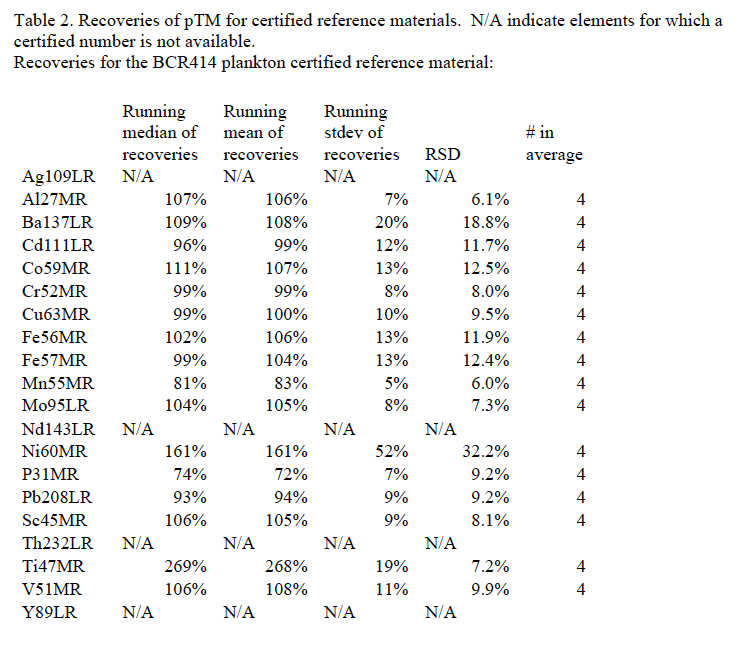
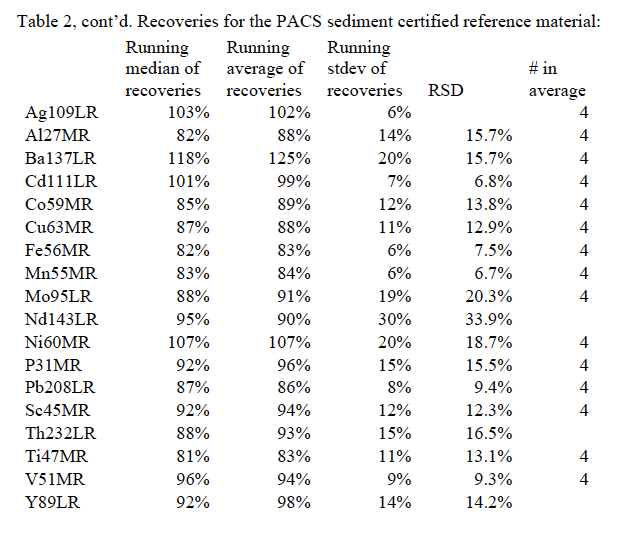
Lab quality control (QC) included running standard reference materials for pTM (BCR414 and PACS-2—see table 2), participation in intercalibration exercises, comparison of pTM profiles with Go-Flo pTM data (Sherrell/Fitzsimmons/Twining/Ohnemus), and checks for oceanographic consistency.
All data have been assigned quality flags using the ODV convention and interpretation:
0=good quality—passed lab QC
1=unknown quality—oceanographically consistent, but no intercalibration possible
4=questionable quality—below detection limit or anomalously high or low
8=bad quality –failed lab QC, or known issue with sample
For barium (Ba_SPT_SPT_PUMP_CONC and Ba_LPT_PUMP_CONC), profiles shapes were sometimes strange in the middle water column (~500-2000m), diverging significantly from generally more oceanographically consistent Go-Flo pTM data. We suspect the occasional precipitation of an insoluble Ba mineral in our digestion procedure. For Ba, we’ve threfore assigned QF=4 to all samples, and further assigned QF=8 to samples in which we most strongly suspect a problem.
BCO-DMO Data Processing Notes:
-Reformatted column names to comply with GEOTRACES and BCO-DMO standards.
-Replaced all blanks, "NaN", "#N/A", and "#VALUE!" with "nd".
-version 12/06/2016: original submission
-version 01/03/2017: error in small size fraction (SPT) particulate trace metals for station 3. Correction affects most SPT parameters for station 3.
-version 01/24/2017: corrected ISO_DateTime_UTC for events 4013 and 4150.
| File |
|---|
particleComposition_joined.csv (Comma Separated Values (.csv), 518.23 KB) MD5:8d02fcb66b7ff03b332e88d7575086dd Primary data file for dataset ID 668083 |
Relationship Description: Dataset 883965, "Compiled Global Dataset of PIC/POC and bSi Concentrations Measured by In Situ Pumps" (contributed by Sijia Dong & Adam Subhas), includes some data from 668083, "GP16 Particle Composition" (contributed by Phoebe Lam).
| Parameter | Description | Units |
| cruise_id | cruise ID | unitless |
| GEOTRC_SAMPNO | GEOTRACES number - uniquely identifies all samples from that pump | unitless |
| PUMP_LAT | Latitude of pump cast; N is positive | decimal degrees |
| PUMP_LON | Longitude of pump cast; E is positive | decimal degrees |
| BTMDEPTH | Water depth at time of cast | meters |
| STNNBR | Station number | unitless |
| CASTNO | Cast number | unitless |
| ISO_DateTime_UTC | Date and time of the midpoint of pumping | unitless |
| DEPTH_MAX | Final depth of pump sample | meters |
| sliters | Volume pumped through the filter holder containing paired Supor filters | liters |
| Y_SPT_CONC_PUMP | Concentration of total particulate yttrium determined by in situ filtration (pump) collected on a main filter (small particles) | picomole per liter |
| Mo_SPT_CONC_PUMP | Concentration of total particulate molybdenum determined by in situ filtration (pump) collected on a main filter (small particles) | picomole per liter |
| Ag_SPT_CONC_PUMP | Concentration of total particulate silver determined by in situ filtration (pump) collected on a main filter (small particles) | picomole per liter |
| Cd_SPT_CONC_PUMP | Concentration of total particulate cadmium determined by in situ filtration (pump) collected on a main filter (small particles) | picomole per liter |
| Ba_SPT_CONC_PUMP | Concentration of total particulate barium determined by in situ filtration (pump) collected on a main filter (small particles) | picomole per liter |
| Nd_SPT_CONC_PUMP | Concentration of total particulate neodymium determined by in situ filtration (pump) collected on a main filter (small particles) | picomole per liter |
| Pb_SPT_CONC_PUMP | Concentration of total particulate lead determined by in situ filtration (pump) collected on a main filter (small particles) | picomole per liter |
| Th_SPT_CONC_PUMP | Concentration of total particulate thorium determined by in situ filtration (pump) collected on a main filter (small particles) | picomole per liter |
| Al_SPT_CONC_PUMP | Concentration of total particulate aluminium determined by in situ filtration (pump) collected on a main filter (small particles) | picomole per liter |
| P_SPT_CONC_PUMP | Concentration of total particulate phosphorus determined by in situ filtration (pump) collected on a main filter (small particles) | picomole per liter |
| Sc_SPT_CONC_PUMP | Concentration of total particulate scandium determined by in situ filtration (pump) collected on a main filter (small particles) | picomole per liter |
| Ti_SPT_CONC_PUMP | Concentration of total particulate titanium determined by in situ filtration (pump) collected on a main filter (small particles) | picomole per liter |
| V_SPT_CONC_PUMP | Concentration of total particulate vanadium determined by in situ filtration (pump) collected on a main filter (small particles) | picomole per liter |
| Mn_SPT_CONC_PUMP | Concentration of total particulate manganese determined by in situ filtration (pump) collected on a main filter (small particles) | picomole per liter |
| Fe_SPT_CONC_PUMP | Concentration of total particulate iron determined by in situ filtration (pump) collected on a main filter (small particles) | picomole per liter |
| Co_SPT_CONC_PUMP | Concentration of total particulate cobalt determined by in situ filtration (pump) collected on a main filter (small particles) | picomole per liter |
| Ni_SPT_CONC_PUMP | Concentration of total particulate nickel determined by in situ filtration (pump) collected on a main filter (small particles) | picomole per liter |
| Cu_SPT_CONC_PUMP | Concentration of total particulate copper determined by in situ filtration (pump) collected on a main filter (small particles) | picomole per liter |
| Y_SPT_CONC_PUMP_QV_ODV | Quality control flag; following the ODV convention | unitless |
| Mo_SPT_CONC_PUMP_QV_ODV | Quality control flag; following the ODV convention | unitless |
| Ag_SPT_CONC_PUMP_QV_ODV | Quality control flag; following the ODV convention | unitless |
| Cd_SPT_CONC_PUMP_QV_ODV | Quality control flag; following the ODV convention | unitless |
| Ba_SPT_CONC_PUMP_QV_ODV | Quality control flag; following the ODV convention | unitless |
| Nd_SPT_CONC_PUMP_QV_ODV | Quality control flag; following the ODV convention | unitless |
| Pb_SPT_CONC_PUMP_QV_ODV | Quality control flag; following the ODV convention | unitless |
| Th_SPT_CONC_PUMP_QV_ODV | Quality control flag; following the ODV convention | unitless |
| Al_SPT_CONC_PUMP_QV_ODV | Quality control flag; following the ODV convention | unitless |
| P_SPT_CONC_PUMP_QV_ODV | Quality control flag; following the ODV convention | unitless |
| Sc_SPT_CONC_PUMP_QV_ODV | Quality control flag; following the ODV convention | unitless |
| Ti_SPT_CONC_PUMP_QV_ODV | Quality control flag; following the ODV convention | unitless |
| V_SPT_CONC_PUMP_QV_ODV | Quality control flag; following the ODV convention | unitless |
| Mn_SPT_CONC_PUMP_QV_ODV | Quality control flag; following the ODV convention | unitless |
| Fe_SPT_CONC_PUMP_QV_ODV | Quality control flag; following the ODV convention | unitless |
| Co_SPT_CONC_PUMP_QV_ODV | Quality control flag; following the ODV convention | unitless |
| Ni_SPT_CONC_PUMP_QV_ODV | Quality control flag; following the ODV convention | unitless |
| Cu_SPT_CONC_PUMP_QV_ODV | Quality control flag; following the ODV convention | unitless |
| Y_SPT_CONC_PUMP_STDEV | Error estimate | picomole per liter |
| Mo_SPT_CONC_PUMP_STDEV | Error estimate | picomole per liter |
| Ag_SPT_CONC_PUMP_STDEV | Error estimate | picomole per liter |
| Cd_SPT_CONC_PUMP_STDEV | Error estimate | picomole per liter |
| Ba_SPT_CONC_PUMP_STDEV | Error estimate | picomole per liter |
| Nd_SPT_CONC_PUMP_STDEV | Error estimate | picomole per liter |
| Pb_SPT_CONC_PUMP_STDEV | Error estimate | picomole per liter |
| Th_SPT_CONC_PUMP_STDEV | Error estimate | picomole per liter |
| Al_SPT_CONC_PUMP_STDEV | Error estimate | picomole per liter |
| P_SPT_CONC_PUMP_STDEV | Error estimate | picomole per liter |
| Sc_SPT_CONC_PUMP_STDEV | Error estimate | picomole per liter |
| Ti_SPT_CONC_PUMP_STDEV | Error estimate | picomole per liter |
| V_SPT_CONC_PUMP_STDEV | Error estimate | picomole per liter |
| Mn_SPT_CONC_PUMP_STDEV | Error estimate | picomole per liter |
| Fe_SPT_CONC_PUMP_STDEV | Error estimate | picomole per liter |
| Co_SPT_CONC_PUMP_STDEV | Error estimate | picomole per liter |
| Ni_SPT_CONC_PUMP_STDEV | Error estimate | picomole per liter |
| Cu_SPT_CONC_PUMP_STDEV | Error estimate | picomole per liter |
| qliters | Volume pumped through the filter holder containing paired QMA filters | liters |
| Y_LPT_CONC_PUMP | Concentration of total particulate Y determined by in situ filtration (pump) collected on a prefilter (large particles) | picomole per liter |
| Mo_LPT_CONC_PUMP | Concentration of total particulate Mo determined by in situ filtration (pump) collected on a prefilter (large particles) | picomole per liter |
| Ag_LPT_CONC_PUMP | Concentration of total particulate Ag determined by in situ filtration (pump) collected on a prefilter (large particles) | picomole per liter |
| Cd_LPT_CONC_PUMP | Concentration of total particulate Cd determined by in situ filtration (pump) collected on a prefilter (large particles) | picomole per liter |
| Ba_LPT_CONC_PUMP | Concentration of total particulate Ba determined by in situ filtration (pump) collected on a prefilter (large particles) | picomole per liter |
| Nd_LPT_CONC_PUMP | Concentration of total particulate Nd determined by in situ filtration (pump) collected on a prefilter (large particles) | picomole per liter |
| Pb_LPT_CONC_PUMP | Concentration of total particulate Pb determined by in situ filtration (pump) collected on a prefilter (large particles) | picomole per liter |
| Th_LPT_CONC_PUMP | Concentration of total particulate Th determined by in situ filtration (pump) collected on a prefilter (large particles) | picomole per liter |
| Al_LPT_CONC_PUMP | Concentration of total particulate Al determined by in situ filtration (pump) collected on a prefilter (large particles) | picomole per liter |
| P_LPT_CONC_PUMP | Concentration of total particulate Pb determined by in situ filtration (pump) collected on a prefilter (large particles) | picomole per liter |
| Sc_LPT_CONC_PUMP | Concentration of total particulate Sc determined by in situ filtration (pump) collected on a prefilter (large particles) | picomole per liter |
| Ti_LPT_CONC_PUMP | Concentration of total particulate Ti determined by in situ filtration (pump) collected on a prefilter (large particles) | picomole per liter |
| V_LPT_CONC_PUMP | Concentration of total particulate V determined by in situ filtration (pump) collected on a prefilter (large particles) | picomole per liter |
| Mn_LPT_CONC_PUMP | Concentration of total particulate Mn determined by in situ filtration (pump) collected on a prefilter (large particles) | picomole per liter |
| Fe_LPT_CONC_PUMP | Concentration of total particulate Fe determined by in situ filtration (pump) collected on a prefilter (large particles) | picomole per liter |
| Co_LPT_CONC_PUMP | Concentration of total particulate Co determined by in situ filtration (pump) collected on a prefilter (large particles) | picomole per liter |
| Ni_LPT_CONC_PUMP | Concentration of total particulate Ni determined by in situ filtration (pump) collected on a prefilter (large particles) | picomole per liter |
| Cu_LPT_CONC_PUMP | Concentration of total particulate Cu determined by in situ filtration (pump) collected on a prefilter (large particles) | picomole per liter |
| Y_LPT_CONC_PUMP_QV_ODV | Quality control flag; following the ODV convention | unitless |
| Mo_LPT_CONC_PUMP_QV_ODV | Quality control flag; following the ODV convention | unitless |
| Ag_LPT_CONC_PUMP_QV_ODV | Quality control flag; following the ODV convention | unitless |
| Cd_LPT_CONC_PUMP_QV_ODV | Quality control flag; following the ODV convention | unitless |
| Ba_LPT_CONC_PUMP_QV_ODV | Quality control flag; following the ODV convention | unitless |
| Nd_LPT_CONC_PUMP_QV_ODV | Quality control flag; following the ODV convention | unitless |
| Pb_LPT_CONC_PUMP_QV_ODV | Quality control flag; following the ODV convention | unitless |
| Th_LPT_CONC_PUMP_QV_ODV | Quality control flag; following the ODV convention | unitless |
| Al_LPT_CONC_PUMP_QV_ODV | Quality control flag; following the ODV convention | unitless |
| P_LPT_CONC_PUMP_QV_ODV | Quality control flag; following the ODV convention | unitless |
| Sc_LPT_CONC_PUMP_QV_ODV | Quality control flag; following the ODV convention | unitless |
| Ti_LPT_CONC_PUMP_QV_ODV | Quality control flag; following the ODV convention | unitless |
| V_LPT_CONC_PUMP_QV_ODV | Quality control flag; following the ODV convention | unitless |
| Mn_LPT_CONC_PUMP_QV_ODV | Quality control flag; following the ODV convention | unitless |
| Fe_LPT_CONC_PUMP_QV_ODV | Quality control flag; following the ODV convention | unitless |
| Co_LPT_CONC_PUMP_QV_ODV | Quality control flag; following the ODV convention | unitless |
| Ni_LPT_CONC_PUMP_QV_ODV | Quality control flag; following the ODV convention | unitless |
| Cu_LPT_CONC_PUMP_QV_ODV | Quality control flag; following the ODV convention | unitless |
| Y_LPT_CONC_PUMP_STDEV | Error estimate | picomole per liter |
| Mo_LPT_CONC_PUMP_STDEV | Error estimate | picomole per liter |
| Ag_LPT_CONC_PUMP_STDEV | Error estimate | picomole per liter |
| Cd_LPT_CONC_PUMP_STDEV | Error estimate | picomole per liter |
| Ba_LPT_CONC_PUMP_STDEV | Error estimate | picomole per liter |
| Nd_LPT_CONC_PUMP_STDEV | Error estimate | picomole per liter |
| Pb_LPT_CONC_PUMP_STDEV | Error estimate | picomole per liter |
| Th_LPT_CONC_PUMP_STDEV | Error estimate | picomole per liter |
| Al_LPT_CONC_PUMP_STDEV | Error estimate | picomole per liter |
| P_LPT_CONC_PUMP_STDEV | Error estimate | picomole per liter |
| Sc_LPT_CONC_PUMP_STDEV | Error estimate | picomole per liter |
| Ti_LPT_CONC_PUMP_STDEV | Error estimate | picomole per liter |
| V_LPT_CONC_PUMP_STDEV | Error estimate | picomole per liter |
| Mn_LPT_CONC_PUMP_STDEV | Error estimate | picomole per liter |
| Fe_LPT_CONC_PUMP_STDEV | Error estimate | picomole per liter |
| Co_LPT_CONC_PUMP_STDEV | Error estimate | picomole per liter |
| Ni_LPT_CONC_PUMP_STDEV | Error estimate | picomole per liter |
| Cu_LPT_CONC_PUMP_STDEV | Error estimate | picomole per liter |
| POM_SPT_CONC_PUMP | Particulate organic matter derived from POC for small particles | ug/L |
| POM_SPT_CONC_PUMP_STDEV | Error estimate | ug/L |
| OPAL_SPT_CONC_PUMP | Opal (hydrated amorphous silica) derived from bSi for small particles | ug/L |
| OPAL_SPT_CONC_PUMP_STDEV | Error estimate | ug/L |
| CaCO3_SPT_CONC_PUMP | Calcium carbonate derived from PIC for small particles | ug/L |
| CaCO3_SPT_CONC_PUMP_STDEV | Error estimate | ug/L |
| LITHO_SPT_CONC_PUMP | Lithogenic particles derived from Al concentrations using a UCC Al composition for small particles | ug/L |
| LITHO_SPT_CONC_PUMP_STDEV | Error estimate | ug/L |
| FeOH3_SPT_CONC_PUMP | Fe oxyhydroxides derived from Fe and using Al to subtract lithogenic component for small particles | ug/L |
| FeOH3_SPT_CONC_PUMP_STDEV | Error estimate | ug/L |
| MnO2_SPT_CONC_PUMP | Mn oxides derived from Mn and using Al to subtract lithogenic component for small particles | ug/L |
| MnO2_SPT_CONC_PUMP_STDEV | Error estimate | ug/L |
| POM_LPT_CONC_PUMP | Particulate organic matter derived from POC for large particles | ug/L |
| POM_LPT_CONC_PUMP_STDEV | Error estimate | ug/L |
| OPAL_LPT_CONC_PUMP | Opal (hydrated amorphous silica) derived from bSi for large particles | ug/L |
| OPAL_LPT_CONC_PUMP_STDEV | Error estimate | ug/L |
| CaCO3_LPT_CONC_PUMP | Calcium carbonate derived from PIC for large particles | ug/L |
| CaCO3_LPT_CONC_PUMP_STDEV | Error estimate | ug/L |
| LITHO_LPT_CONC_PUMP | Lithogenic particles derived from Al concentrations using a UCC Al composition for large particles | ug/L |
| LITHO_LPT_CONC_PUMP_STDEV | Error estimate | ug/L |
| FeOH3_LPT_CONC_PUMP | Fe oxyhydroxides derived from Fe and using Al to subtract lithogenic component for large particles | ug/L |
| FeOH3_LPT_CONC_PUMP_STDEV | Error estimate | ug/L |
| MnO2_LPT_CONC_PUMP | Mn oxides derived from Mn and using Al to subtract lithogenic component for large particles | ug/L |
| MnO2_LPT_CONC_PUMP_STDEV | Error estimate | ug/L |
| SPM_SPT_CONC_PUMP | Suspended particulate matter derived from POM; OPAL; CaCO3; LITHO; FeOH3; MnO2 in small particles | ug/L |
| SPM_SPT_CONC_PUMP_STDEV | Error estimate | ug/L |
| SPM_LPT_CONC_PUMP | Suspended particulate matter derived from POM; OPAL; CaCO3; LITHO; FeOH3; MnO2 in large particles | ug/L |
| SPM_LPT_CONC_PUMP_STDEV | Error estimate | ug/L |
| POM_SPT_CONC_PUMP_QV_ODV | Quality control flag; following the ODV convention | unitless |
| OPAL_SPT_CONC_PUMP_QV_ODV | Quality control flag; following the ODV convention | unitless |
| CaCO3_SPT_CONC_PUMP_QV_ODV | Quality control flag; following the ODV convention | unitless |
| LITHO_SPT_CONC_PUMP_QV_ODV | Quality control flag; following the ODV convention | unitless |
| FeOH3_SPT_CONC_PUMP_QV_ODV | Quality control flag; following the ODV convention | unitless |
| MnO2_SPT_CONC_PUMP_QV_ODV | Quality control flag; following the ODV convention | unitless |
| SPM_SPT_CONC_PUMP_QV_ODV | Quality control flag; following the ODV convention | unitless |
| POM_LPT_CONC_PUMP_QV_ODV | Quality control flag; following the ODV convention | unitless |
| OPAL_LPT_CONC_PUMP_QV_ODV | Quality control flag; following the ODV convention | unitless |
| CaCO3_LPT_CONC_PUMP_QV_ODV | Quality control flag; following the ODV convention | unitless |
| LITHO_LPT_CONC_PUMP_QV_ODV | Quality control flag; following the ODV convention | unitless |
| FeOH3_LPT_CONC_PUMP_QV_ODV | Quality control flag; following the ODV convention | unitless |
| MnO2_LPT_CONC_PUMP_QV_ODV | Quality control flag; following the ODV convention | unitless |
| SPM_LPT_CONC_PUMP_QV_ODV | Quality control flag; following the ODV convention | unitless |
| PIC_SPT_PUMP_CONC | Particulate inorganic carbon in small particles | umol C/L |
| PIC_LPT_PUMP_CONC | Particulate inorganic carbon in large particles | umol C/L |
| PIC_SPT_PUMP_CONC_STDEV | Error estimate | umol C/L |
| PIC_LPT_PUMP_CONC_STDEV | Error estimate | umol C/L |
| bSi_SPT_PUMP_CONC | Biogenic silica in small particles | nmol Si/L |
| bSi_LPT_PUMP_CONC | Biogenic silica in large particles | nmol Si/L |
| bSi_SPT_PUMP_CONC_STDEV | Error estimate | nmol Si/L |
| bSi_LPT_PUMP_CONC_STDEV | Error estimate | nmol Si/L |
| POC_LPT_PUMP_CONC | Particulate organic carbon in large particles | umol C/L |
| POC_LPT_PUMP_CONC_QV_ODV | Quality control flag; following the ODV convention | unitless |
| PN_LPT_PUMP_CONC | Particulate nitrogen in large particles | umol N/L |
| PN_LPT_PUMP_CONC_QV_ODV | Quality control flag; following the ODV convention | unitless |
| POC_SPT_PUMP_CONC | Particulate organic carbon in small particles | umol C/L |
| POC_SPT_PUMP_CONC_QV_ODV | Quality control flag; following the ODV convention | unitless |
| PN_SPT_PUMP_CONC | Particulate nitrogen in small particles | umol N/L |
| PN_SPT_PUMP_CONC_QV_ODV | Quality control flag; following the ODV convention | unitless |
| d13C_LPT_PUMP_CONC_raw | particulate C-13 isotopic composition; raw; large particles | permil |
| d13C_LPT_PUMP_CONC_QV_ODV | Quality control flag; following the ODV convention | unitless |
| d15N_LPT_PUMP_CONC_raw | particulate N-15 isotopic compostion; raw; large particles | permil |
| d15N_LPT_PUMP_CONC_QV_ODV | Quality control flag; following the ODV convention | unitless |
| d13C_LPT_PUMP_CONC_dbcorr | Particulate C-13 isotopic composition; corrected for blank Delta13C; large particles | permil |
| d13C_LPT_PUMP_CONC_dbcorr_QV_ODV | Quality control flag; following the ODV convention | unitless |
| d15N_LPT_PUMP_CONC_dbcorr | Particulate N-15 isotopic composition; corrected for blank Delta15N; large particles | permil |
| d15N_LPT_PUMP_CONC_dbcorr_QV_ODV | Quality control flag; following the ODV convention | unitless |
| POC_LPT_PUMP_CONC_STDEV | Error estimate | umol C/L |
| POC_SPT_PUMP_CONC_STDEV | Error estimate | umol C/L |
| PN_LPT_PUMP_CONC_STDEV | Error estimate | umol N/L |
| PN_SPT_PUMP_CONC_STDEV | Error estimate | umol N/L |
| PIC_SPT_PUMP_CONC_QV_ODV | Quality control flag; following the ODV convention | unitless |
| PIC_LPT_PUMP_CONC_QV_ODV | Quality control flag; following the ODV convention | unitless |
| bSi_SPT_PUMP_CONC_QV_ODV | Quality control flag; following the ODV convention | unitless |
| bSi_LPT_PUMP_CONC_QV_ODV | Quality control flag; following the ODV convention | unitless |
| GEOTRC_EVENTNO | GEOTRACES event number | unitless |
| Dataset-specific Instrument Name | self-recording Seabird 19plus CTD |
| Generic Instrument Name | CTD Sea-Bird |
| Dataset-specific Description | Used to for sampling and to verify target depths |
| Generic Instrument Description | A Conductivity, Temperature, Depth (CTD) sensor package from SeaBird Electronics. This instrument designation is used when specific make and model are not known or when a more specific term is not available in the BCO-DMO vocabulary. Refer to the dataset-specific metadata for more information about the specific CTD used. More information from: http://www.seabird.com/ |
| Dataset-specific Instrument Name | Carlo Erba 1108 or a CE Instruments NC2500 elemental analyzer |
| Generic Instrument Name | Elemental Analyzer |
| Dataset-specific Description | Measured POC and PN |
| Generic Instrument Description | Instruments that quantify carbon, nitrogen and sometimes other elements by combusting the sample at very high temperature and assaying the resulting gaseous oxides. Usually used for samples including organic material. |
| Dataset-specific Instrument Name | Lachat QuikChem 8000 Flow Injection Analyzer |
| Generic Instrument Name | Flow Injection Analyzer |
| Dataset-specific Description | Ran samples |
| Generic Instrument Description | An instrument that performs flow injection analysis. Flow injection analysis (FIA) is an approach to chemical analysis that is accomplished by injecting a plug of sample into a flowing carrier stream. FIA is an automated method in which a sample is injected into a continuous flow of a carrier solution that mixes with other continuously flowing solutions before reaching a detector. Precision is dramatically increased when FIA is used instead of manual injections and as a result very specific FIA systems have been developed for a wide array of analytical techniques. |
| Dataset-specific Instrument Name | ThermoFinnigan Delta Plus XP isotope ratio mass spectrometer |
| Generic Instrument Name | Isotope-ratio Mass Spectrometer |
| Dataset-specific Description | Used to measure C and N stable isotopes |
| Generic Instrument Description | The Isotope-ratio Mass Spectrometer is a particular type of mass spectrometer used to measure the relative abundance of isotopes in a given sample (e.g. VG Prism II Isotope Ratio Mass-Spectrometer). |
| Dataset-specific Instrument Name | Element-XR ICP-MS (Thermo Scientific) |
| Generic Instrument Name | Mass Spectrometer |
| Dataset-specific Description | Inductively Coupled Mass Spectrometetry (HR-ICP-MS) |
| Generic Instrument Description | General term for instruments used to measure the mass-to-charge ratio of ions; generally used to find the composition of a sample by generating a mass spectrum representing the masses of sample components. |
| Dataset-specific Instrument Name | Flash EA1112 Carbon/Nitrogen Analyzer |
| Generic Instrument Name | Particulate Organic Carbon/Nitrogen Analyzer |
| Dataset-specific Description | POC was measured |
| Generic Instrument Description | A unit that accurately determines the carbon and nitrogen concentrations of organic compounds typically by detecting and measuring their combustion products (CO2 and NO). |
| Dataset-specific Instrument Name | McLane Research in-situ pumps |
| Generic Instrument Name | Pump |
| Dataset-specific Description | Used to collect size-fractioned particles |
| Generic Instrument Description | A pump is a device that moves fluids (liquids or gases), or sometimes slurries, by mechanical action. Pumps can be classified into three major groups according to the method they use to move the fluid: direct lift, displacement, and gravity pumps |
| Dataset-specific Instrument Name | Shimadzu UV-2550 UV-VIS Spectrophotometer |
| Generic Instrument Name | Spectrophotometer |
| Dataset-specific Description | Used to run samples manually |
| Generic Instrument Description | An instrument used to measure the relative absorption of electromagnetic radiation of different wavelengths in the near infra-red, visible and ultraviolet wavebands by samples. |
TN303
| Website | |
| Platform | R/V Thomas G. Thompson |
| Report | |
| Start Date | 2013-10-25 |
| End Date | 2013-12-20 |
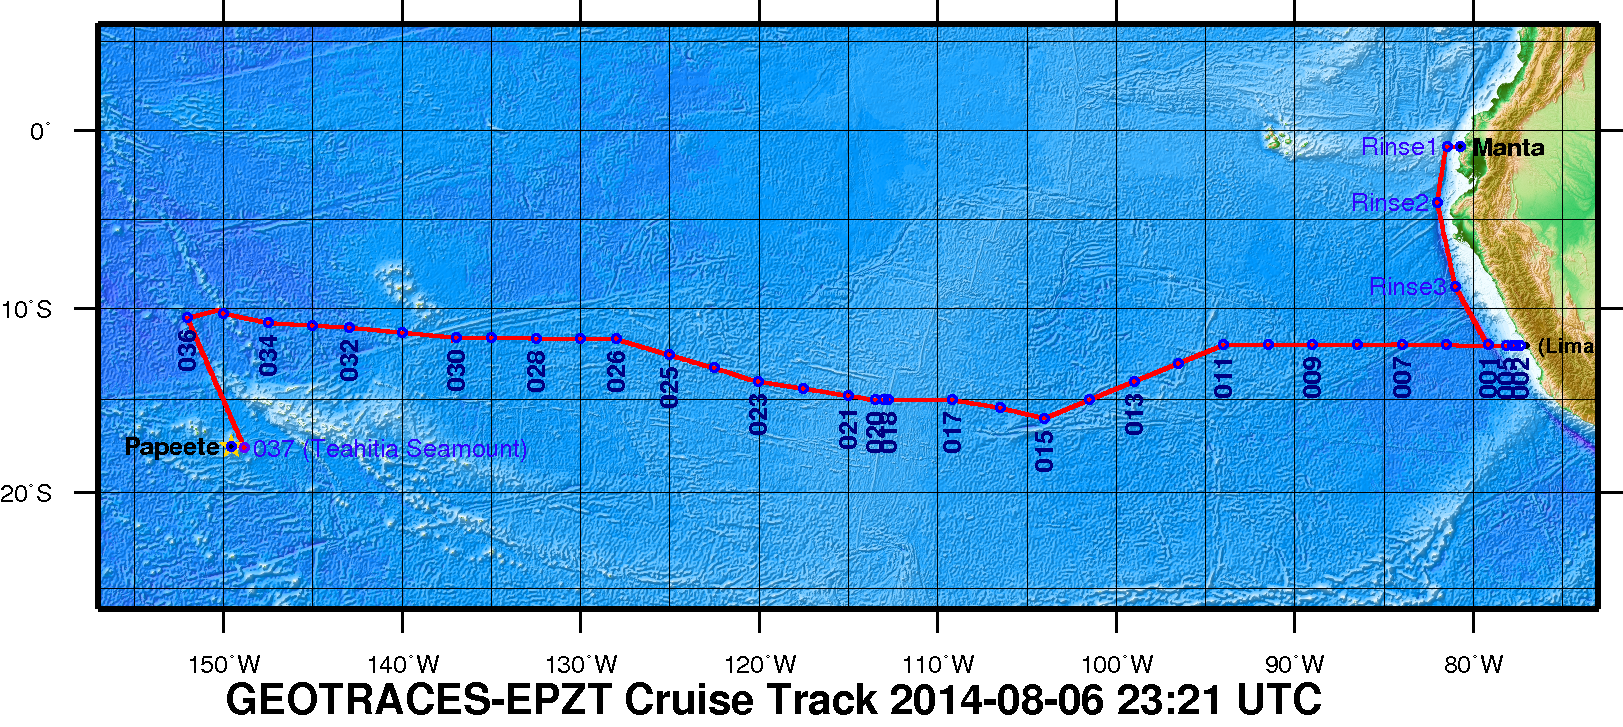
| Description | A zonal transect in the eastern tropical South Pacific (ETSP) from Peru to Tahiti as the second cruise of the U.S.GEOTRACES Program. This Pacific section includes a large area characterized by high rates of primary production and particle export in the eastern boundary associated with the Peru Upwelling, a large oxygen minimum zone that is a major global sink for fixed nitrogen, and a large hydrothermal plume arising from the East Pacific Rise. This particular section was selected as a result of open planning workshops in 2007 and 2008, with a final recommendation made by the U.S.GEOTRACES Steering Committee in 2009. It is the first part of a two-stage plan that will include a meridional section of the Pacific from Tahiti to Alaska as a subsequent expedition.
Figure 1. The 2013 GEOTRACES EPZT Cruise Track. [click on the image to view a larger version]
Additional cruise information is available from the Rolling Deck to Repository (R2R): http://www.rvdata.us/catalog/TN303 |
U.S. GEOTRACES East Pacific Zonal Transect (GP16) (U.S. GEOTRACES EPZT)
From the NSF Award Abstract
The mission of the International GEOTRACES Program (https://www.geotraces.org/), of which the U.S. chemical oceanography research community is a founding member, is "to identify processes and quantify fluxes that control the distributions of key trace elements and isotopes in the ocean, and to establish the sensitivity of these distributions to changing environmental conditions" (GEOTRACES Science Plan, 2006). In the United States, ocean chemists are currently in the process of organizing a zonal transect in the eastern tropical South Pacific (ETSP) from Peru to Tahiti as the second cruise of the U.S.GEOTRACES Program. This Pacific section includes a large area characterized by high rates of primary production and particle export in the eastern boundary associated with the Peru Upwelling, a large oxygen minimum zone that is a major global sink for fixed nitrogen, and a large hydrothermal plume arising from the East Pacific Rise. This particular section was selected as a result of open planning workshops in 2007 and 2008, with a final recommendation made by the U.S.GEOTRACES Steering Committee in 2009. It is the first part of a two-stage plan that will include a meridional section of the Pacific from Tahiti to Alaska as a subsequent expedition.
This award provides funding for management of the U.S.GEOTRACES Pacific campaign to a team of scientists from the University of Southern California, Old Dominion University, and the Woods Hole Oceanographic Institution. The three co-leaders will provide mission leadership, essential support services, and management structure for acquiring the trace elements and isotopes samples listed as core parameters in the International GEOTRACES Science Plan, plus hydrographic and nutrient data needed by participating investigators. With this support from NSF, the management team will (1) plan and coordinate the 52-day Pacific research cruise described above; (2) obtain representative samples for a wide variety of trace metals of interest using conventional CTD/rosette and GEOTRACES Sampling Systems; (3) acquire conventional JGOFS/WOCE-quality hydrographic data (CTD, transmissometer, fluorometer, oxygen sensor, etc) along with discrete samples for salinity, dissolved oxygen (to 1 uM detection limits), plant pigments, redox tracers such as ammonium and nitrite, and dissolved nutrients at micro- and nanomolar levels; (4) ensure that proper QA/QC protocols are followed and reported, as well as fulfilling all GEOTRACES Intercalibration protocols; (5) prepare and deliver all hydrographic-type data to the GEOTRACES Data Center (and US data centers); and (6) coordinate cruise communications between all participating investigators, including preparation of a hydrographic report/publication.
Broader Impacts: The project is part of an international collaborative program that has forged strong partnerships in the intercalibration and implementation phases that are unprecedented in chemical oceanography. The science product of these collective missions will enhance our ability to understand how to interpret the chemical composition of the ocean, and interpret how climate change will affect ocean chemistry. Partnerships include contributions to the infrastructure of developing nations with overlapping interests in the study area, in this case Peru. There is a strong educational component to the program, with many Ph.D. students carrying out thesis research within the program.
Figure 1. The 2013 GEOTRACES EPZT Cruise Track. [click on the image to view a larger version]
Collaborative Research: GEOTRACES Pacific Section: The Geochemistry of Size-fractionated Suspended Particles Collected by In-situ Filtration (EPZT Particle Geochemistry)
NSF Award Abstract:
Particles play essential roles in the cycling and distribution of trace elements and isotopes (TEI). For instance scavenging onto particles and removal by particle export is a major sink for many TEIs. However the driving factors affecting the spatial extent and temporal variability of TEI scavenging remain largely unknown. The U.S. GEOTRACES East Pacific Zonal Transect between Peru and Tahiti will cross three biogeochemically important areas, setting the stage for researchers to constrain unknowns surrounding particle scavenging.
Scientists from Woods Hole Oceanographic Institution and University of Minnesota-Twin Cities will address fundamental questions on the location of particle formation, particle-dissolved species interactions, dominant particle phases, and the evolution of particle phases during transport. As regards particle phases, the researchers will measure particulate organic carbon (POC), calcium carbonate, opal, lithogenics, and oxyhydroxides, as well as the trace element compositions of size fractionated particles covering three distinct zones: large lateral productivity gradients, a major oxygen deficient zone off the coast of Peru, and a world renowned hydrothermal plume emanating from the southern East Pacific Rise. Furthermore, since previous results suggest particle type affects scavenging, investigators will specifically measure acid-leachable trace metals, particle concentration, and major particle composition. These combined measurements will allow them to disentangle the relative importance of hydrothermal particles, benthic nepheloid layers, and high productivity margins for scavenging of TEIs. The cruise transect will also offer unique opportunities to examine the speciation of Fe and POC in hydrothermal particles away from the vent field and the effects of aggregation and POC coatings on TEI partitioning.
As regards broader impacts, the researchers plan to create an educational module on particulate trace metals in the ocean which would become part of a five part GEOTRACES webinar series developed by Dr. Benjamin Twining at the Bigelow Laboratory for Ocean Sciences in collaboration with the Center for Ocean Sciences Education Excellence-Ocean Systems at the University of Maine. One graduate student from Woods Hole Oceanographic Institution and one graduate student from the University of Minnesota, Twin Cities, would be supported and trained as part of this project. In addition, an undergraduate student would participate in the research during the summer month as part of the Woods Hole Diversity Initiative Partnership in Education program.
U.S. GEOTRACES (U.S. GEOTRACES)
GEOTRACES is a SCOR sponsored program; and funding for program infrastructure development is provided by the U.S. National Science Foundation.
GEOTRACES gained momentum following a special symposium, S02: Biogeochemical cycling of trace elements and isotopes in the ocean and applications to constrain contemporary marine processes (GEOSECS II), at a 2003 Goldschmidt meeting convened in Japan. The GEOSECS II acronym referred to the Geochemical Ocean Section Studies To determine full water column distributions of selected trace elements and isotopes, including their concentration, chemical speciation, and physical form, along a sufficient number of sections in each ocean basin to establish the principal relationships between these distributions and with more traditional hydrographic parameters;
* To evaluate the sources, sinks, and internal cycling of these species and thereby characterize more completely the physical, chemical and biological processes regulating their distributions, and the sensitivity of these processes to global change; and
* To understand the processes that control the concentrations of geochemical species used for proxies of the past environment, both in the water column and in the substrates that reflect the water column.
GEOTRACES will be global in scope, consisting of ocean sections complemented by regional process studies. Sections and process studies will combine fieldwork, laboratory experiments and modelling. Beyond realizing the scientific objectives identified above, a natural outcome of this work will be to build a community of marine scientists who understand the processes regulating trace element cycles sufficiently well to exploit this knowledge reliably in future interdisciplinary studies.
Expand "Projects" below for information about and data resulting from individual US GEOTRACES research projects.
| Funding Source | Award |
|---|---|
| NSF Division of Ocean Sciences (NSF OCE) |
[ table of contents | back to top ]