Sediment PLFA isotope values from Massachusetts collected from 2012-2015
Project
| Contributors | Affiliation | Role |
|---|---|---|
| Spivak, Amanda | Woods Hole Oceanographic Institution (WHOI) | Principal Investigator |
| Ake, Hannah | Woods Hole Oceanographic Institution (WHOI BCO-DMO) | BCO-DMO Data Manager |
Abstract
Sediment PLFA isotope values.
Methodology from Spivak, AC and J Ossolinski. 2016. Limited effects of nutrient enrichment on bacterial carbon sources in salt marsh tidal creek sediments. Marine Ecology Progress Series. 544:107-130. 10.3354/meps11587
Sediment samples for organic matter composition were collected by placing a hard plastic sleeve around a polyvinyl chloride (PVC) corer (5 cm diameter x 15 cm deep) and then removing the corer. The plastic sleeve remained in place to maintain the integrity of the sediment column and mark the core location. The top 0.5 cm of each core was collected into pre-combusted vials and frozen (-80 deg C) until analysis.
Lipid biomarker compounds were extracted using a modified Bligh and Dyer (1959) method. Sediment samples were extracted with a chloroform : methylene chloride : phosphate buffer saline mixture (2:1:0.8, v:v:v) using a microwave-accelerated reaction system (MARS6); samples were heated to 80deg C for 10 min with continuous stirring. Following extraction, samples were partitioned and the organic phase was removed. The total lipid extract was concentrated under N2 and samples were separated on silica gel columns by eluting with chloroform, acetone (F1/2), and methanol (F3) (Guckert et al. 1985). The F3 (phospholipids) was dried under N2 and saponified with 0.5 M NaOH at 70 deg C for 4 h. Saponified samples were acidified and extracted three times with hexane. The extract was methylated with acidic methanol (95:5 methanol: HCl) and heated overnight at 70deg C to form fatty acid methyl esters (FAME). Samples were analyzed with an Agilent 7890 gas chromatograph with an effluent split ~70:30 between a 5975C mass spectrometer and a flame ionization detector. Peaks were separated on an Agilent DB-5 ms column (60 m, 0.25 mm inner diameter, 0.25 μm film). FAME concentrations were quantified using methyl heneicosanoate as an internal standard. FAs are designated A:BwC, where A is the number of carbon atoms, B is the number of double bonds, and C is the position of the first double bond from the aliphatic ‘w’ end of the molecule. The prefixes ‘i’ and ‘a’ refer to iso and anteiso methyl branched FAs and indicate whether the methyl group is attached to the penultimate or antepenultimate carbon atoms (Bianchi & Canuel 2011).
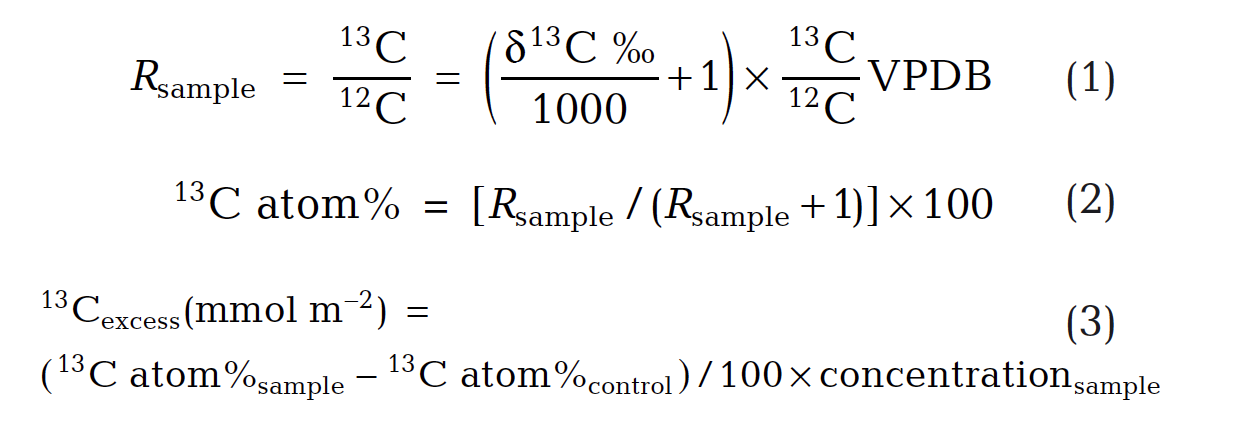
Stable carbon isotope ratios of FAMEs (F3) were determined by the WHOI Organic Mass Spectrometry Facility with a Hewlett-Packard 6890 GC interfaced to a DeltaPlus IRMS. Excess 13C was calculated per Eqs. 1 – 3, where samples collected prior to 13C label application were controls and PLFA concentrations were in units of moles m-2.
PLFA isotopic values were derived from the isotopic composition of FAMEs and corrected for the d13C of the carbon added during methylation using a mass balance approach. We analyzed total PLFA concentrations as well as concentrations and isotopic composition of compounds and subclasses representing algae (polyunsaturated fatty acids C20:4w6, C20:5w3; PUFA), bacteria (iso- and anteiso- branched C15:0, C17:0; BrFA), sulfate reducing bacteria (10-methyl C16:0), and a combination of algae and microbes (short chain fatty acids C12:0, C14:0; SCFA) (Perry et al. 1979, Kaneda 1991, Volkman et al. 1998). The d13C of PLFA subclasses was calculated as concentrated weighted averages. In order to evaluate the sources of carbon supporting sediment bacteria in the tidal creeks, PLFA isotopic values measured in initial sediment samples (i.e., pre-label application) were corrected for a -3 0/00 fractionation during lipid synthesis (Hayes 2001, Bouillon & Boschker 2006).
BCO-DMO Data Processing Notes:
-reformatted column names to comply with BCO-DMO standards.
-removed spaces from data
-filled in blank cells with nd
| File |
|---|
sediment_PLFA.csv (Comma Separated Values (.csv), 10.14 KB) MD5:5113ac1506dc542619010827173008b5 Primary data file for dataset ID 668443 |
| Parameter | Description | Units |
| month | Month samples were collected; mm | unitless |
| core_ID | Core ID | unitless |
| estuary | Estuary where samples were collected. | unitless |
| time | Number of hours elapsed since application of the 13C label; 0 represents samples collected immediately before label application. | hours |
| experiment | Refers to whether the 13 label was added as NaHCO3 (ie BMA) or S. alterniflora (ie S alt) detritus. | unitless |
| C12 | Concentration of a combination of algae and microbes; short chain fatty acid | percentage |
| C14 | Concentration of a combination of algae and microbes; short chain fatty acid | percentage |
| iso_C15 | Concentration of bacteria | percentage |
| anteiso_C15 | Concentration of bacteria | percentage |
| C16 | Concentration of sulfate reducing bacteria | percentage |
| Methyl_10_C16 | Concentration of sulfate reducing bacteria | percentage |
| iso_C17 | Concentration of bacteria | percentage |
| anteiso_C17 | Concentration of bacteria | percentage |
| C18 | Total PLFA concentration | percentage |
| C20_4w6 | Isotopic composition of compounds and subclasses representing algae; polyunsaturated fatty acids | percentage |
| C20_5w3 | Isotopic composition of compounds and subclasses representing algae; polyunsaturated fatty acids | percentage |
| Dataset-specific Instrument Name | flame ionization detector |
| Generic Instrument Name | Flame Ionization Detector |
| Dataset-specific Description | Used to analyze samples |
| Generic Instrument Description | A flame ionization detector (FID) is a scientific instrument that measures the concentration of organic species in a gas stream. It is frequently used as a detector in gas chromatography. Standalone FIDs can also be used in applications such as landfill gas monitoring, fugitive emissions monitoring and internal combustion engine emissions measurement in stationary or portable instruments. |
| Dataset-specific Instrument Name | Agilent 7890 gas chromatograph |
| Generic Instrument Name | Gas Chromatograph |
| Dataset-specific Description | effluent split ~70:30 |
| Generic Instrument Description | Instrument separating gases, volatile substances, or substances dissolved in a volatile solvent by transporting an inert gas through a column packed with a sorbent to a detector for assay. (from SeaDataNet, BODC) |
| Dataset-specific Instrument Name | Hewlett-Packard 6890 GC interfaced to a DeltaPlus IRMS |
| Generic Instrument Name | Isotope-ratio Mass Spectrometer |
| Dataset-specific Description | Usted to determine stable isotope ratios |
| Generic Instrument Description | The Isotope-ratio Mass Spectrometer is a particular type of mass spectrometer used to measure the relative abundance of isotopes in a given sample (e.g. VG Prism II Isotope Ratio Mass-Spectrometer). |
| Dataset-specific Instrument Name | 5975C mass spectrometer |
| Generic Instrument Name | Mass Spectrometer |
| Dataset-specific Description | Used to analyze samples |
| Generic Instrument Description | General term for instruments used to measure the mass-to-charge ratio of ions; generally used to find the composition of a sample by generating a mass spectrum representing the masses of sample components. |
| Dataset-specific Instrument Name | polyvinyl chloride (PVC) corer |
| Generic Instrument Name | Push Corer |
| Dataset-specific Description | 5 cm diameter x 15 cm deep |
| Generic Instrument Description | Capable of being performed in numerous environments, push coring is just as it sounds. Push coring is simply pushing the core barrel (often an aluminum or polycarbonate tube) into the sediment by hand. A push core is useful in that it causes very little disturbance to the more delicate upper layers of a sub-aqueous sediment.
Description obtained from: http://web.whoi.edu/coastal-group/about/how-we-work/field-methods/coring/ |
Spivak_2012
| Website | |
| Platform | shoreside Massachusetts |
| Start Date | 2012-09-01 |
| End Date | 2015-08-15 |
Eutrophication Effects on Sediment Metabolism and Benthic Algal-bacterial Coupling: An Application of Novel Techniques in a LTER Estuary (Benthic_PP_at_TIDE)
Extracted from the NSF award abstract:
This project will address how rates of benthic microalgal production respond to eutrophication and geomorphological changes in human-impacted tidal creeks. Excess nutrient loading increases benthic algal biomass and likely stimulates production rates but the magnitude of nutrient and geomorphological effects on rates of production is unknown. Will changes in benthic algal productivity affect algal-bacterial coupling? Furthermore, how is algal-bacterial coupling affected by geomorphological changes, which may be exacerbated by excess nutrient loading but can also occur in pristine marshes?
This project will take advantage of the infrastructure of the TIDE project, a long-term saltmarsh eutrophication experiment at the Plum Island Ecosystem - Long Term Ecological Research site in Northeastern Massachusetts. Specifically, the PIs will measure benthic metabolism and examine algal- bacterial coupling in fertilized and ambient nutrient tidal creeks in the first field season. The following field season, they will compare sediment metabolism and carbon dynamics on slumped tidal creek walls (i.e. areas where low marsh has collapsed into the tidal creek) to that on the bottom of tidal creeks. In both years, gross and net production will be determined using an innovative triple oxygen isotope technique and traditional dissolved oxygen and inorganic carbon flux measurements. Comparisons between these methods will be useful in informing studies of sediment metabolism. Lipid biomarkers will be used to characterize the sources of organic matter to creek sediments, and stable isotope analysis of bacterial specific biomarkers to identify the sources of organic carbon utilized by sediment bacteria. The biomarkers will reveal whether sediment bacteria use organic matter substrates, such as benthic microalgal carbon, selectively or in proportion to availability. Overall, results from the proposed study will provide important information about how sediment carbon dynamics in shallow tidal creeks respond to long term eutrophication. Furthermore, findings will enhance understanding of the role of tidal creeks in coastal biogeochemistry.
| Funding Source | Award |
|---|---|
| NSF Division of Ocean Sciences (NSF OCE) |
[ table of contents | back to top ]