Size-binned particle abundance and biovolume of the gut contents of salps imaged via scanning electron microscopy on the "SalpPOOP" cruise on R/V Tangaroa during October and November 2018
Project
| Contributors | Affiliation | Role |
|---|---|---|
| Fender, Christian | Florida State University (FSU) | Principal Investigator |
| Decima, Moira | University of California-San Diego Scripps (UCSD-SIO) | Co-Principal Investigator |
| Stukel, Michael R. | Florida State University (FSU) | Co-Principal Investigator |
| Rauch, Shannon | Woods Hole Oceanographic Institution (WHOI BCO-DMO) | BCO-DMO Data Manager |
Abstract
Note: A less condensed dataset containing all particle size, volume, and converted biomass values from each salp gut is available in the related dataset "Salp Gut Particle Sizes" (https://www.bco-dmo.org/dataset/880927).
58 salps representing the species Salpa thompsoni, Pegea confoederata, Thalia democratica, Soestia zonaria, Thetys vagina, Salpa fusiformis, and Ihlea magalhanica, including both solitary and aggregate stages of the first four and a distribution of sizes for the first two, were collected during the "SalpPOOP" cruise on R/V Tangaroa. Salps were collected via twice daily oblique Bongo tows down to 200 meters as well as daily ring net surface tows with a 30-liter non-filtering cod-end. Once onboard, salps from ring net and Bongo tows were identified to the species level, sorted by life stage (i.e., solitary or aggregate), measured, and sexed (Foxton et al. 1966; Lüskow et al. 2020). Triplicate representative samples for each salp species from a total of 10 of these casts were preserved in 5% formalin < 30 minutes after collection the first time each species was encountered.
Once ashore, SEM samples were prepared from each preserved organism by excising guts under a HEPA-filter equipped laminar flow exhaust hood using acid-cleaned plastic dissection equipment to minimize contamination. Guts were then placed in either 15 or 50 mL plastic Falcon tubes with a small volume of brine, lacerated, and then vortex mixed for two minutes to release gut contents into solution while minimizing damage to the more fragile phytoplankton (Jung et al. 2010; von Harbou et al. 2011; Ahmad-Ishak 2017). An aliquot of this solution was then filtered onto a 0.2 μm Nuclepore filter, followed by six rinses of decreasing salinity in 5 ppt increments for a minimum of 5 minutes each with the final MilliQ water rinse performed twice. This was immediately followed by a dehydration series of increasing ratios of Ethanol:MilliQ to purge water from the sample, with the final 100% anhydrous ethanol step again performed twice. Finally, a substitution series of increasing ratios of the chemical drying agent hexamethyldisilazane (HMDS):anhydrous ethanol was conducted with each step lasting a minimum of 10 minutes, with the final HMDS step being allowed to air dry. Each step was conducted under either a light vacuum or gravity filtration depending on material concentration to minimize loss between treatments. The dried filter was then affixed to an aluminum SEM stub using carbon conductive adhesive tabs and further grounded with a thin piece of carbon conductive tape touching the edge of the filter and the bottom of the stub. Samples were then sputter coated with 10 nm iridium and visualized using an FEI Nova 400 NanoSEM set to an accelerating voltage of 10 kV. Twenty random regions of each filter were imaged at 3 different magnifications: ~500x, ~2,500x, and ~12,000x to target microplankton (20-200 µm), nanoplankton (2-20 µm), and picoplankton (<2 µm), respectively.
Particles in SEM images were manually outlined using ImageJ (v. 1.52a or 1.53c) to extract the maximum feret length (Feret.um), minimum feret length, and area (Area.um2). These measurements were used to estimate equivalent spherical diameter (ESD.um), biovolume (BV), and carbon biomass assuming a prolate spheroid. To avoid overestimating the size of irregularly shaped particles, we calculated width (Width.um) for a prolate spheroid of measured area and length such that:
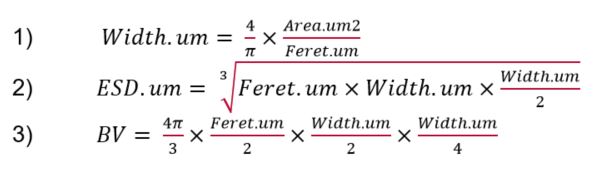
(Note: The equations in this image are also attached as Supplemental File "SalpGut_Particles_Equations.JPG".)
Note that because we estimated the three-dimensional size of particles using a two-dimensional image, we determined the height of each particle from its width. To account for the ~50% flattening of height caused by filtration (Taylor et al. 2011), we furthermore assumed height to be equivalent to half of the width. This correction was only applied for soft-bodied groups such as picoplankton and most nanoplankton, while for incompressible particles such as diatoms and dinoflagellates no correction was applied.
Since sufficient structural detail could not be observed to definitively identify very small particles, spherical particles within the size range of ~0.4-1.5 µm and resembling control images from lab cultures of Prochlorococcus sp. and Synechococcus sp. are instead referred to as bacteria-like particles (PartType "BLP"). Other PartTypes include: “WS” for white spheres assumed to be partially digested nanoflagellates; “Unknown” for nondetrital particles for which a classification could not be provided; "Alex" for Alexandrium spp.-like dinoflagellates; "ProB" for Prorocentrum minimum; "ProD" for Prorocentrum dentratum; "UnkDino" for unknown dinoflagellates; "Cyst" for particles resembling the resting stage cysts of diatoms; "Oxy" for Oxytoxum spp.; "Cerat" for Ceratium spp.; "CeratSpike" for only a portion of a Ceratium horn; "Tin" for tintinnids; "Pennate" for unknown pennate diatoms; "Dicty" for Dictyocha speculum; "UnkCocc" for particles similar to coccolithophores but with distinct holes at regular intervals (possibly just digestion artefacts); "Centric" for unknown centric diatoms; "SmallPen" for smaller, possibly nitzschiaform diatoms that smaller and fatter about the center than "Pennate"; "Diplo" for Diplopelta spp.; "Cocco" for unknown coccolithophores; "Frag" for Fragilariopsis spp.; "Radio" for unknown polycystine radiolarians; "Pnut" for unknown pennate diatoms with shape reminiscent of a peanut; "Pyro" for Pyrodinium spp.; "RaphDia” for unknown pennate diatom with distinct raphid ridge; "Dinoph" for Dinophysis spp.; "Ciliate" for unknown ciliates. Each class may also be proceeded by a "B", connotating the particle was considered broken or missing more than ¾ its true size. "CeratSpike" was considered broken as well.
The biomass of formalin-preserved ciliates was estimated as 0.14 pg C µm⁻³ (Putt and Stoecker 1989) while rhizarians were 0.001 pg C mm⁻³ (Stukel et al. 2018). The biomass of diatoms was estimated allometrically as 0.288*BV^0.811 while other protists and unidentified particles were estimated using 0.216*BV^0.939 (Menden-Deuer and Lessard 2000). Because we could not differentiate between types of prokaryotes in the SEM images, we calculated a single average biomass conversion for all bacteria-like particles in the salp guts using published allometric relationships weighted by the ratio of each of the key bacterial groups to each other in the water column from flow cytometry data for a given cycle.
Data Processing:
This dataset was achieved by splitting the particles in the companion dataset "Salp Gut Particle Sizes" for a given individual into discrete size bins (see Related Dataset https://www.bco-dmo.org/dataset/880927). To calculate "X-Y Abundance", the sum of the adjusted counts ("TotCount") for particles larger than X and smaller than Y within a salp gut was divided by the bin width, or Y-X. The resulting columns represent the Normalized Abundance Size Spectrum, or NASS. Biomass was similarly calculated with the exception of rather than summing the particle counts from "Salp Gut Particle Sizes", we sum the converted carbon biomass (column "TotBiomass" in "Salp Gut Particle Sizes"). The result is the Normalized Biomass Size Spectrum, or NBSS.
Because we noted a lack of chain-forming diatoms as well as many broken particles, we also apply a correction for size to all chain-forming diatoms and broken particles observed in the raw data. This correction was determined by first finding the relative proportions of solitary and chained diatoms in the water column for each cycle using FlowCam data (or non-broken particles of the same type in the salp gut when not possible). We then randomly reassigned every diatom and/or broken particle in the salp guts to a size class weighted by its respective relative contribution to the water column. The effective abundance of the particle was then calculated as the fraction of its biovolume to that of the "average particle" of its type from that cycle. The carbon content was applied to the reassigned size class unchanged to avoid biasing the NBSS high. This process was then repeated 10,000 times in a Monte Carlo random resampling scheme to account for additional introduced uncertainty in these reassignments. The values reported here represent the mean NASS/NBSS for each size class of particle within each salp across all 10,000 simulations.
BCO-DMO Processing:
- started with file named "SalpGut_ReducedV2.xlsx" received February 2023;
- converted dates to YYYY-MM-DD format;
- converted times to hh:mm format;
- renamed fields to comply with BCO-DMO naming conventions;
- added date-time fields in ISO8601 (UTC) format: YYYY-MM-DDThh:mmZ;
- converted latitudes and longitudes to decimal degrees.
| File |
|---|
salp_gut_reduced.csv (Comma Separated Values (.csv), 19.36 KB) MD5:294c5f132659d6875eabcb893609d059 Primary data file for dataset ID 881172. |
| File |
|---|
SalpGut_Particles_Equations.JPG (JPEG Image (.jpg), 21.87 KB) MD5:868b5a9f7813b406caa217bc0d8862a6 Equations used in calculating width, equivalent spherical diameter (ESD), and biovolume (BV) from particle SEM images.
Associated with datasets 880927 and 881172, "Salp Gut Particle Sizes" and "Salp Gut Carbon Content", from Christian Fender. |
Relationship Description: This dataset was achieved by splitting the particles in the companion dataset "Salp Gut Particle Sizes" (880927) for a given individual into discrete size bins.
| Parameter | Description | Units |
| Sample | Identifier for individual salps | unitless |
| Species | Species of salp particle originates from. IM=Ihlea magalhanica, SF=Salpa fusiformis, ST=Salp thompsoni, TD=Thalia democratica, SZ=Soestia zonaria, TV=Thetys vagina, PC=Pegea confoederata | unitless |
| Life_Stage | Life stage of salp particle originates from. B=Blastozooid, O=Oozooid | unitless |
| TL_After | Salp length after removal from formalin | millimeters (mm) |
| Date_Caught_NZST | Date salp sample was collected in NZST time zone | unitless |
| Start_Time_NZST | Start time of net trawl salp was caught in (NZST) | unitless |
| End_Time_NZST | End time of net trawl salp was caught in (NZST) | unitless |
| Start_ISO_DateTime_UTC | Date and start time (in UTC) of net trawl salp was caught in as ISO 8601 format | unitless |
| End_ISO_DateTime_UTC | Date and end time (in UTC) of net trawl salp was caught in as ISO 8601 format | unitless |
| Cycle | Lagrangian experiment number | unitless |
| Station | Deployment number | unitless |
| Start_Latitude | Latitude at which net trawl began; negative values = South | decimal degrees North |
| Start_Longitude | Longitude at which net trawl began; negative values = West | decimal degrees East |
| End_Latitude | Latitude at which net trawl ended; negative values = South | decimal degrees North |
| End_Longitude | Longitude at which net trawl ended; negative values = West | decimal degrees East |
| Start_water_depth | Depth at location which net trawl began | meters (m) |
| End_water_depth | Depth at location which net trawl ended | meters (m) |
| Date_Prepped_EST | Date of gut excision and preparation in EST time zone | unitless |
| Aliquot_Fraction | Fraction of whole gut suspension filtered for SEM | unitless |
| Gut_Major_Axis | Length of longest side of excised gut | millimeters (mm) |
| Gut_Minor_Axis | Length of shortest side of excised gut | millimeters (mm) |
| Abundance_quarter_to_half | Particle abundance in size bin 0.25 to 0.5 micrometers (um) normalized to bin width | number per micrometer (#/um) |
| Abundance_half_to_1 | Particle abundance in size bin 0.5 to 1 micrometers (um) normalized to bin widt | number per micrometer (#/um) |
| Abundance_1_to_2 | Particle abundance in size bin 1 to 2 micrometers (um) normalized to bin width | number per micrometer (#/um) |
| Abundance_2_to_4 | Particle abundance in size bin 2 to 4 micrometers (um) normalized to bin width | number per micrometer (#/um) |
| Abundance_4_to_8 | Particle abundance in size bin 4 to 8 micrometers (um) normalized to bin width | number per micrometer (#/um) |
| Abundance_8_to_16 | Particle abundance in size bin 8 to 16 micrometers (um) normalized to bin width | number per micrometer (#/um) |
| Abundance_16_to_32 | Particle abundance in size bin 16 to 32 micrometers (um) normalized to bin width | number per micrometer (#/um) |
| Abundance_32_to_64 | Particle abundance in size bin 32 to 64 micrometers (um) normalized to bin width | number per micrometer (#/um) |
| Abundance_64_to_128 | Particle abundance in size bin 64 to 128 micrometers (um) normalized to bin width | number per micrometer (#/um) |
| Abundance_128_to_256 | Particle abundance in size bin 128 to 256 micrometers (um) normalized to bin width | number per micrometer (#/um) |
| Abundance_256_to_512 | Particle abundance in size bin 256 to 512 micrometers (um) normalized to bin width | number per micrometer (#/um) |
| Abundance_512_to_1024 | Particle abundance in size bin 512 to 1024 micrometers (um) normalized to bin width | number per micrometer (#/um) |
| Biomass_quarter_to_half | Summed biomass in size bin 0.25 to 0.5 micrometers (um) normalized to bin width | picograms Carbon per micrometer (pg C/um) |
| Biomass_half_to_1 | Summed biomass in size bin 0.5 to 1 micrometers (um) normalized to bin width | picograms Carbon per micrometer (pg C/um) |
| Biomass_1_to_2 | Summed biomass in size bin 1 to 2 micrometers (um) normalized to bin width | picograms Carbon per micrometer (pg C/um) |
| Biomass_2_to_4 | Summed biomass in size bin 2 to 4 micrometers (um) normalized to bin width | picograms Carbon per micrometer (pg C/um) |
| Biomass_4_to_8 | Summed biomass in size bin 4 to 8 micrometers (um) normalized to bin width | picograms Carbon per micrometer (pg C/um) |
| Biomass_8_to_16 | Summed biomass in size bin 8 to 16 micrometers (um) normalized to bin width | picograms Carbon per micrometer (pg C/um) |
| Biomass_16_to_32 | Summed biomass in size bin 16 to 32 micrometers (um) normalized to bin width | picograms Carbon per micrometer (pg C/um) |
| Biomass_32_to_64 | Summed biomass in size bin 32 to 64 micrometers (um) normalized to bin width | picograms Carbon per micrometer (pg C/um) |
| Biomass_64_to_128 | Summed biomass in size bin 64 to 128 micrometers (um) normalized to bin width | picograms Carbon per micrometer (pg C/um) |
| Biomass_128_to_256 | Summed biomass in size bin 128 to 256 micrometers (um) normalized to bin width | picograms Carbon per micrometer (pg C/um) |
| Biomass_256_to_512 | Summed biomass in size bin 256 to 512 micrometers (um) normalized to bin width | picograms Carbon per micrometer (pg C/um) |
| Biomass_512_to_1024 | Summed biomass in size bin 512 to 1024 micrometers (um) normalized to bin width | picograms Carbon per micrometer (pg C/um) |
| Dataset-specific Instrument Name | Bongo tows |
| Generic Instrument Name | Bongo Net |
| Generic Instrument Description | A Bongo Net consists of paired plankton nets, typically with a 60 cm diameter mouth opening and varying mesh sizes, 10 to 1000 micron. The Bongo Frame was designed by the National Marine Fisheries Service for use in the MARMAP program. It consists of two cylindrical collars connected with a yoke so that replicate samples are collected at the same time. Variations in models are designed for either vertical hauls (OI-2500 = NMFS Pairovet-Style, MARMAP Bongo, CalVET) or both oblique and vertical hauls (Aquatic Research). The OI-1200 has an opening and closing mechanism that allows discrete "known-depth" sampling. This model is large enough to filter water at the rate of 47.5 m3/minute when towing at a speed of two knots. More information: Ocean Instruments, Aquatic Research, Sea-Gear |
| Dataset-specific Instrument Name | ring net surface tows |
| Generic Instrument Name | Ring Net |
| Generic Instrument Description | A Ring Net is a generic plankton net, made by attaching a net of any mesh size to a metal ring of any diameter. There are 1 meter, .75 meter, .25 meter and .5 meter nets that are used regularly. The most common zooplankton ring net is 1 meter in diameter and of mesh size .333mm, also known as a 'meter net' (see Meter Net). |
| Dataset-specific Instrument Name | FEI Nova 400 NanoSEM set to an accelerating voltage of 10 kV |
| Generic Instrument Name | Scanning Electron Microscope |
| Generic Instrument Description | A scanning electron microscope (SEM) scans a focused electron beam over a surface to create an image. The electrons in the beam interact with the sample, producing various signals that can be used to obtain information about the surface topography and composition. |
TAN1810
| Website | |
| Platform | R/V Tangaroa |
| Start Date | 2018-10-23 |
| End Date | 2018-11-21 |
Collaborative Research: Quantifying trophic roles and food web ecology of salp blooms of the Chatham Rise (Salp Food Web Ecology)
NSF Award Abstract:
Salps are unique open-ocean animals that range in size from a few millimeters to greater than twenty centimeters, have a gelatinous (jelly-like) body, and can form long chains of many connected individuals. These oceanic organisms act as oceanic vacuum cleaners, having incredibly high feeding rates on phytoplankton and, unusual for consumers of their size, smaller bacteria-sized prey. This rapid feeding and the salps' tendency to form dense blooms, allows them move substantial amounts of prey carbon from the surface into the deep ocean, leading to carbon dioxide removal from the atmosphere. However, salps are often considered a trophic dead-end, rather than a link, in the food web due to the assumption that they themselves are not consumed, since their gelatinous bodies are less nutritious than co-occurring crustacean prey. Along with this, salp populations are hypothesized to be increasing due to climate change. This proposal addresses these questions: 1) Do salps compete primarily with crustaceans (as in the prevailing paradigm) or are they competitors of single-celled protists, which are the dominant grazers of small phytoplankton? 2) Do salp blooms increase the efficiency of food-web pathways from tiny phytoplankton to fisheries production in nutrient-poor ocean regions?
This project will support the interdisciplinary education of a graduate student who will learn modeling and laboratory techniques in the fields of biological and chemical oceanography and stimulate international collaborations between scientists in the United States and New Zealand. Additionally, several Education and Outreach initiatives are planned, including development of a week-long immersive high school class in biological oceanography, and education modules that will serve the "scientists-in-the schools" program in Tallahassee, FL.
It is commonly assumed that salps are a trophic sink. However, this idea was developed before the discovery that protists (rather than crustaceans) are the dominant grazers in the open ocean and was biased by the difficulty of recognizing gelatinous salps in fish guts. More recent studies show that salps are found in guts of a diverse group of fish and seabirds and are a readily available prey source when crustacean abundance is low. This proposal seeks to quantify food web flows through contrasting salp-dominated and salp-absent water parcels near the Chatham Rise off western New Zealand where salp blooms are a predictable phenomenon. The proposal will leverage previously obtained data on salp abundance, bulk grazing impact, and biogeochemical significance during Lagrangian experiments conducted by New Zealand-based collaborators. The proposal will determine 1) taxon- and size-specific phytoplankton growth rate measurements, 2) taxon- and size-specific protozoan and salp grazing rate measurements, 3) compound specific isotopic analysis of the amino acids of mesozooplankton to quantify the trophic position of salps, hyperiid amphipods, and other crustaceans, 4) sediment traps to quantify zooplankton carcass sinking rates, and 5) linear inverse ecosystem modeling syntheses. Secondary production and trophic flows from this well-constrained ecosystem model will be compared to crustacean-dominated and microbial loop-dominated ecosystems in similarly characterized regions (California Current, Costa Rica Dome, and Gulf of Mexico).
This award reflects NSF's statutory mission and has been deemed worthy of support through evaluation using the Foundation's intellectual merit and broader impacts review criteria.
| Funding Source | Award |
|---|---|
| NSF Division of Ocean Sciences (NSF OCE) | |
| NSF Division of Ocean Sciences (NSF OCE) |
[ table of contents | back to top ]